


The United states used to be the bread basket of the world, not only the leading producer in all grain production category with the exception of rice, and exporter in the world. Due to stiff competition from Europe, Russia, Ukraine and China would no longer hold that title. We do however export the most food stuff in the world. Has the switch to corn production for ethanol production had an effect on this trend? I will investigate this subject thoroughly and try to come up with an answer. Due to the war in the Ukraine, there will be a shortage of wheat in the world. So why should this affect the US price of bread and wheat products? Is it due to price gouging or are we no longer producing enough wheat to meet our needs? This is going to prove to be a complicated story, of this I have no doubt.
China has become the leading grain producer in the world, just edging out the US. However, due to their enormous population great need of food stuff, they export very little in comparison. Below I have included the top 8 grain producers in the world.
8 Countries that Produce the Most Grain in the World
If you’re wondering which countries feed the most people, take a look at this list of 8 countries that produce the most grain in the world. Although countries on this list below produce high quantities of all types of grain, there’s still close to 800 million people living with less food required to lead healthy lives according to UN World Food Program’s Hunger Statistics. That’s 1 in 9 people on the planet. Still, things would have been much worse if it weren’t for world’s largest grain producers. Similar can be said for the countries that produce the most fish in the world. These countries too do their fair share of global hunger relieving. Sadly, it’s still far from enough.
Before we begin, let’s first define grain. When mentioning grain, most people first think of wheat. While wheat certainly qualifies as a type of grain, it’s far from only one. Small, hard, dry seeds can be divided into cereals and legumes – with us being mostly interested in former. Cereals themselves are further divided into warm and cool-season cereals, but they all belong to the grass (Poaceae) family. Warm-season cereals include the likes of maize (corn) and millet, while cool-season cereals are generally more widespread and include grains such as already mentioned wheat, barley, rice, rye, oats, etc. Of course, we can’t simply forget all legumes. Soybeans, for instance, play an important role in global grain production and consumption diagrams.
In order to compile our list of 8 countries that produce the most grain in the world, we have decided to gather the data from Food and Agriculture Organization of the United Nations Statistics Division or simply FAOSTAT. Furthermore, we have decided to include a few types of grain as one or two wouldn’t give us a clear picture. The most common types of grain are those produced the most. By looking at grain production curves, we have singled out the following types of grain that are being produced in large quantities: wheat, maize, rice, soybeans and barley. We have gathered the data for all five mentioned grain types and calculated totals for each country producing these commodities. We know that most countries don’t produce all types of mentioned grain, but we only thought it would fair to include the grain types with largest production outputs. For instance, you’ll be hard-pressed to find rice on European or North American fields or barley in Asia, but they will effectively cancel each other out anyway. All data has been gathered for the year 2013 which is the last available year for these five types of grains, and all values are showcased in metric tons. Let’s take a look at countries that produce the most grain in the world now.
8. Canada
Total Production: 67,319,400 metric tons
Canada produces all considered types of grain, excluding Rice of course. The Great White North mostly produces wheat – 37,529,600 metric tons. The second most produced Canadian grain type is maize, which comes to 14,193,800 metric tons, then barley at 10,237,100 metric tons and finally soybeans with 5,358,900 metric tons.
7. Russia
Total Production: 81,685,645 metric tons
The Russian Federation has somewhat larger production output than Canada, but follows a similar pattern. Most of the Russian grain production falls on wheat with 52,090,796 metric tons. Barley comes second with 15,388,704 metric tons and maize is third with 11,634,943 metric tons. Finally, Russians produce 1,636,259 metric tons of soybeans and even 934,943 metric tons of rice.

6. Indonesia
Total Production: 89,791,565 metric tons
Indonesia makes this list of 8 countries that produce the most grain in the world thanks to high rice production output. Indonesia produces 71,279,712 metric tons of this commodity and additional 18,511,853 metric tons of maize to complete the picture. Production of wheat, barley and soybeans in Indonesia is possible only in controlled conditions because of the climate.
5. Argentina
Total Production: 96,882,360 metric tons
Argentinian grain production mostly consists of soybeans and maize, which amount to 49,306,200 metric tons and 32,119,211 metric tons respectively. Next in line is wheat with the total yearly production of 9,188,339 metric tons. Barley and rice sit at the bottom with the production of 4,705,160 metric tons and 1,563,450 metric tons respectively.

4. Brazil
Total Production: 179,849,353 metric tons
Brazil is the second biggest soybean producer in the world with production of 81,724,477 metric tons a year. Maize follows close by with 80,273,172 metric tons, then comes rice with 11,782,549 metric tons and wheat with 5,738,473 metric tons. Finally, the largest South American country produces 330,682 metric tons of barley.

3. India
Total Production: 289,698,000 metric tons
One of the largest countries in the world and the second largest country by population simply has to produce an abundance of food. India is world’s second biggest rice producer with 159,200,000 metric tons a year. They are also the second largest wheat producers with 93,510,000 metric tons. Maize production comes to 23,290,000 metric tons; soybeans come to 11,948,000 metric tons and India produces 1,750,000 metric tons of barley as well.
2. The United States
Total Production: 516,351,276 metric tons
The United States are by far the biggest maize producer in the world with yearly production coming to 353,699,441 metric tons. They are also world’s leading producer of soybeans with 91,389,350 metric tons. Finally, the United States produce solid 57,966,656 metric tons of wheat, 8,613,094 metric tons of rice and 4,682,735 metric tons of barley.

1. China
Total Production: 557,677,392 metric tons
Although it was a photo finish, China takes number one spot among these 8 countries that produce the most grain in the world. China is the world’s biggest rice and wheat producer with 203,612,192 metric tons and 121,926,400 metric tons respectively. China also has a high maize production output, which amounts to 218,489,000 metric tons. Finally, Chinese produce 11,950,500 metric tons of soybeans and 1,699,300 metric tons of barley.

The World’s 6 Biggest Corn Producers
More corn is produced than any other grain crop, and for good reason. It is a staple food for many people and a major component of livestock feed. Corn is used as a high-fructose sweetener in many processed foods, and it’s the main ingredient in corn oil, corn starch, and corn syrup.
Corn can be used to create ethanol fuel, and even the cobs have industrial uses for their absorbent qualities.
Corn is grown as a cash crop around the world. Production data for the 2019–2020 production season is used for this list of major corn-producing nations.
1. United States
The U.S. is by far the world’s largest producer and exporter of corn, with production in the 2019–2020 season pegged at 346.0 million metric tons. The acreage dedicated to planting corn changes from season to season, but in all about 90 million acres of American land are planted with corn each season. Domestic consumption was a large percentage of the total, and approximately half of that was used as feed grain for livestock.
2. China
China’s current season corn production is estimated at 260.8 million metric tons, and it is consumed almost exclusively domestically. While the country is a major corn producer, the number of acres that Chinese farmers dedicate to corn will likely decline now that the government has ended price supports on domestic corn. Farmers can be expected to switch to higher-value crops such as soybeans. If corn demand remains high while supply dwindles, China could increase the amount of corn that it imports.
3. Brazil
Brazil is a major producer of many crops including coffee, sugar, and soybeans, and it is the world’s third-largest corn producer. Of the estimated 102 million metric tons of corn that the country produces annually, most will be consumed domestically.3
4. Argentina
Argentina is a significant producer of corn, and also a significant exporter of it. Its annual corn production is estimated at 51 million metric tons, but its corn consumption nationally doesn’t even make the top 10 list worldwide. Although precise figures are not available, that means it exports more than half its production.
5. Ukraine
Ukraine had a record amount of corn produced in 2019 at 35.9 million metric tons. The country has used its rich soil to grow their production from their 2017 season when they produced less than 25 million metric tons.
6. India
The list of top producers stays pretty stable from year to year. That said, India is creeping up on the list slowly but surely. It now produces 26 million metric tons per year of corn.
As I mentioned previously, US farmers have switched production to corn production for ethanol, due to higher profits and government subsidies, this has resulted in an increase in the price of corn for food as well as feed for livestock. This has resulted in an increase in the cost of meat and poultry as well, and dairy products. There is no need for corn to be used in ethanol production. We have enough natural gas that we could use it for automobiles. If public transit buses can use natural gas, so can automobiles and trucks. It is estimated that we have over 1,000 years of natural gas supply in the US alone. Now if we used more for automobiles that would decrease the supply some. However even if it reduced it to 500 years, I would think that we would have other forms of transportation by then that would not be s reliable on fossil fuels. However this article is not about energy it is about grain production, so lets not get too side tracked. Due to the length of the article on the effects of ethanol production on the US, I have placed it in the addendum section. In the next portion I am going to delve a little more deeply on the pros and cons of ethanol.
Ethanol seems like a recent fuel invention, but its first instance of use happened in 1826. This corn-based fuel was used to power an engine at the time. Nicolaus Otto, who invented the four-cycle internal combustion engine, also used this resource to power early models of his work. It was even used as a lighting fuel in the 1850s, but Americans stopped used it after taxes were placed on it to pay for the Civil War.
Ethanol was the fuel that gave power to Henry Ford’s Model T in the early 20th century. It became an octane booster for regular fuels in the 1920s, and then became in high demand because of the fuel shortages that happened during World War II.
The modern ethanol industry began in the 1970s when petroleum fuels became expensive and scarce. Environmental concerns about the use of leaded gasoline created a new need for octane. Since corn is abundant and the predominant feedstock grown in the United States, it only made sense to make it the foundation of a new approach to modern fuel.
There are several pros and cons of corn ethanol to review as we move toward an eco-friendly future.
List of the Pros of Corn Ethanol
1. It provides the world with a greener method of producing fuel.
Ethanol products create fewer greenhouse gas emissions than the other fuels that we currently use. Because the production process involves cultivation, processing, and distilling, it does not get rid of its fossil fuel impact immediately. What it can provide is a 13% reduction in total emissions when compared to traditional gasoline products that don’t receive blending. If producers mix corn ethanol with switchgrass or sugarcane, the environmental benefits improve to reduce our impact on the atmosphere even further.
2. Corn ethanol creates usable byproducts for additional revenues.
The benefit of an ethanol fuel burning cleaner than pure gasoline is enough of an interest to consider using it for many people. When you look at the creation process, a sludge-like byproduct comes from this fuel’s creation.
This food product is rich in protein, making it a nutritious forage option for livestock. Corn ethanol stock can double the usage of the crops that farmers grow, creating the potential for additional revenues. When you also consider the fact that a single gallon provides almost 70% more energy than what it takes to produce it, this option can help us to create an efficient transportation network.
3. Corn ethanol byproducts can be made into non-food products.
Corn ethanol production is useful in the creation of items like dry ice. We can also use the processing capabilities of this agricultural item so that it works as a supportive product for pneumatic systems. When we look at the advantages of the byproduct for food-related purposes, about one metric ton of it replaces around 1.25 tons of cornmeal for agricultural needs.
4. This fuel is more eco-friendly than standard gasoline.
Although there are additional production actions involved in the distillation of ethanol when compared to standard gasoline, there are also significant environmental benefits to consider. Consuming ethanol without other fuels generates up to a 30% smaller carbon footprint compared to what traditional unleaded gasoline. When you look at the older leaded variety, the results are even more profound.
Since we have the option to blend corn ethanol with standard gasoline in today’s vehicles, it is possible to decrease emissions without creating a notable variation in our lifestyle.
5. The corn ethanol market has become competitive with other fuels.
Ethanol could grow as an alternative fuel in the United States because of the government subsidies supporting it. Industry producers received a $0.45 per gallon subsidy before 2012. Although critics propose that this resource would have never become successful without having taxpayer-funded supports available to it, the corn ethanol products show no signs of slowing down since the unsubsidized price became competitive with traditional items.
This advantage means that the corn ethanol industry has the power to stand on its own while implementing significant increases to the Gross Domestic Product (GDP).
6. Corn ethanol is compatible with global fuel distribution systems.
We can blend ethanol with traditional gasoline, use it by itself, or take advantage of its flexibility in a variety of distinct ways. This advantage occurs because of the infrastructure we already have in place. Existing fuel stations that serve drivers and other vehicular needs can administer this product. Distribution pipelines and refinery networks help to create stable production levels, providing this fuel to wherever needs exist throughout the country.
Corn ethanol is stable enough for long-distance shipping, creating a useful export that generates more funds for the economy. Although American ethanol consumption is primarily domestic, this advantage means that we can incorporate many of the bonuses of this cleaner-burning fuel without paying significant expenses trying to conceive of networks that allow us to use the fuel in the first place.
7. It is not a fuel product that meets the definition of human compatibility.
Corn ethanol creation occurs when the combination of sugars and starch from the stock turns into a mash during its processing steps. That product is then cooked and cooled. Then an enzyme called “glucoamylase” goes into the product so that the fermentation process begins.
After 48 hours, this set of steps will create a 10% ethanol mixture. Then producers force the entire mixture through the heating process again to evaporate any water from the current batch. The corn ethanol will then go through another cooling process that incorporates dehydration to create 200-proof grain alcohol. A small amount of gasoline gets added to this final product to make it unusable as a food product so that fuel outlets across the United States receive it under safer conditions.
8. We don’t need a lot of agricultural space to be available to produce corn ethanol.
Corn ethanol production rose from 6 billion gallons in 2007 to 14 billion gallons in 2014. The number of plants doubled at that time as well, creating a dramatic increase in the availability of this fuel. Higher corn prices create an incentive for farms to plant more of this crop. When there is a local producer, this impact rises even higher. Although changes to the pricing structure of corn led to an 8.5% increase in availability, the total amount of cropland dedicated to this crop only rose by 2%.
In 2014, a lot of the land which did convert into crops for ethanol production went back to non-crop purposes. That means the overall change in cropland use for corn ethanol from2008 to 2014 rose by only 0.5%.
9. It is more efficient to use corn than other crops to make ethanol.
Other countries might use sugarcane or switchgrass to produce ethanol to make the practice more sustainable, but corn also offers positives to consider. If we were to start creating ethanol from soybeans, then it would require a diversion of about 60% of today’s crop to meet the needs for just biodiesel production. Corn only requires about a 40% diversion rate, and many of the farmers that grow the crop are already producing items that are not meant for human consumption in the first place.
List of the Cons of Corn Ethanol
1. It uses a significant portion of the corn crop in the United States.
The corn ethanol crop in the United States totaled 5.6 billion bushels in 2018. That figure represents over 38% of the total corn crop in the U.S. being devoted to a process where the primary product it creates isn’t edible. Working papers from the National Center for Environmental Economics found that a 1 billion gallon increase in ethanol production results in an average increase to corn prices of at least 3%. There are also changes in government policy on fuel or poor weather conditions that could increase the cost even more.
2. The market for corn ethanol was established through the use of subsidies.
Corn ethanol stopped being subsidized by the federal government in 2012 at the rate of $0.45 per gallon. Tariffs placed on Brazilian imports of the fuel were eliminated at the same time. The only way to establish the market was to offer $45 billion in benefits to the producers of this fuel to ensure that a pro-ethanol policy established itself in the marketplace. The government still advocates for the specific use of this fuel, requiring 36 billion gallons of biofuel products to be blended with gasoline by 2022.
3. Corn ethanol offers a smaller combustion profile than other fuels.
When you compare the effectiveness of corn ethanol to that of standard gasoline, then there is 40% less energy available to drivers on a full fuel tank. That means 1.4 gallons of ethanol is necessary to replace what one gallon of petroleum-based fuel can offer to the average vehicle. When you increase the percentage of corn ethanol in the fuel, then this disadvantage rises.
Vehicles that use an 85% corn ethanol option will see a 25% reduction or more in their gas mileage. Critics point out that this fuel might burn cleaner than standard gasoline, but operators are using more of it to accomplish positive results. That means the environmental improvements that become possible with this fuel resource are restricted since buyers must use more of it.
4. Valuable land is needed to grow the crops for corn ethanol in the first place.
Some sustainable crop options make corn ethanol a viable product, but the majority of them use land that may be better suited to food production. Some of this problem occurs because the U.S. is the prime manufacturer of this fuel. When there are hunger issues to resolve in the United States and around the world, the idea of creating a cash crop that has little human food value produces an ethical question about how we use our agriculture.
This problem could settle if we can move toward more efficient versions of corn ethanol. If we cannon, then the price of corn will cause other food costs to increase because the commodity expenses keep rising. The cost per corn bushel rose by more than $2.20 over the past 30 years as the United States government worked to develop the ethanol industry.
5. Refining gasoline from petroleum is cheaper than making corn ethanol.
When we study the ultimate cost to produce corn ethanol, then it is currently $1.74 per gallon, according to figures released in 2009. The cost of manufacturing gasoline is only $0.95 per gallon, according to the same study. Although this disadvantage does go away when oil prices rise above $110 per barrel, there isn’t an economic advantage available for this industry unless subsidies are in place. Since consumers pay for that financial benefit, each household still pays the full price for the use of their vehicle.
That means the agricultural workers who develop the crops that make corn ethanol can’t afford to use the fuel they help to create if they want to create a sustainable business structure.
6. There are energy cost disadvantages to consider with corn ethanol.
Even though ethanol is an efficient fuel source because it produces more energy than needed to create it, some energy cost calculations don’t go into that final total. Cornell University discovered that the average acre of corn in the United States yields more than 7,000 pounds of usable products. That yield creates over 300 gallons of ethanol. When you consider the planting, growing, and harvesting costs on an industrial scale, then about 140 gallons of gasoline are necessary to create this product. That creates a cost-per-acre figure of $347.
When you add the energy costs of corn production and ethanol conversion to those figures, it takes over 130,000 BTUs to make one gallon of ethanol. It will have an energy value of 77,000 BTUs, which means it requires about 70% more energy to create it than we obtain from it.
7. Growing corn for ethanol requires high levels of artificial soil supports.
When farmers decide to start using their land to produce corn for ethanol, then significant levels of herbicide and synthetic fertilizer are often necessary. Growing this crop is one of the most frequent sources of sediment pollution and nutrient elimination in the United States. When this product is grown on an industrial scale, then this disadvantage becomes even more hazardous. That’s not to say the issue is insurmountable, but there is also a component of practicality to consider. Most croplands require a rotation to maximize production levels. If monoculture is the priority because of the cash benefits available, then there could be an eventual decrease in the levels of food availability.
8. Corn ethanol production could reduce employment opportunities.
Advocates of corn ethanol imply that farmers would have the chance to make more money and hire additional help if they pursue this cash crop. The opposite effect could also happen. When farms are searching for extra profits, then there could be more sporadic employment opportunities available. Livestock pursuances need more human power than growing corn. It is an issue that could even reduce the amount of food available worldwide if this problem continues to operate using market forces.
9. We must have consistent growing seasons to maintain ethanol levels.
If the United States suffers from a poor agricultural year, then there would be a pressing and tense decline of corn ethanol availability. The same dilemma exists for all other forms of this fuel except for cellulose-based products.
We can only produce the amount of corn ethanol that our crops provide. Having a season defined by drought, flooding, or cold temperatures could reduce fuel supplies immediately. There could also be difficulties with pests and diseases to consider, so the pricing of this commodity is a little unpredictable when compared to similar resources
10. Corn ethanol could increase greenhouse gas emissions.
Ethanol does produce fewer emissions than gasoline in a direct consumption comparison. When the United States introduced this alternative fuel to the national supply chain, the total number of greenhouse gases produced from transportation rose. Drivers felt like they could get behind the wheel more often because they were doing less harm to the environment. The increased time spent behind the wheel created a change in habits that eventually led to a 20% surge in CO2 levels.
Conclusion
The pros and cons of corn ethanol attempt to balance specific environmental benefits with higher consumer costs. There are wage and employment benefits to look at with this commodity, but it also requires governmental interventions to establish the product as viable because of the expensive production processes.
If you use an E10 blend in a standard vehicle, then carbon monoxide emissions decrease by up to 30%. There are similar toxicity and CO2 reductions experienced at the same time. A switch to ethanol nationwide in the U.S. is even credited with a reduction in smog.
Ethanol might need more energy to create it than what it provides, but there is conflicting information on that topic. We do know that Brazil and the United States have seen plenty of success with this fuel alternative. Europe, Asia, and Australia are looking at the benefits of using sustainable biofuels because of how well ethanol performs. That’s why most people see the benefits outweighing the potential disadvantages of this product despite its high price tag.
Lets discuss how Russia became the leading wheat producer.
How Russia became the world’s LEADING wheat exporter
Russia sells more wheat than any other country in the world. At the same time, its domestic grain consumption is growing, too. So how did Russia manage to achieve this breakthrough in wheat exports?
In 2020, Russia will retain its title of the world’s largest wheat exporter, according to data from the U.S. Department of Agriculture’s Foreign Agricultural Service (FAS USDA).
In its October report, FAS raised the wheat harvest forecast for Russia (without Crimea) by 5 million tons, to 83 million tons. The country’s export potential in the 2020/21 season was increased from 37.5 million to 39 million tons. The runner-up, the United States, is forecast to export 27 million tons of wheat this year, followed by the EU with 25.5 million tons.
Where does Russia stand as a wheat supplier?

For the past several years, Russia has been in the top 10 exporters of grain crops, including barley, corn, rye and, oats, but especially wheat. In 2017-2019, it was the biggest exporter of wheat, accounting for about 20 percent of the world market.
“Over the past decade, Russia has more than doubled its wheat exports, while the world market has grown by only a third. The country’s share of the global [wheat] market has practically doubled in that time,” says Denis Ternovsky, a leading researcher at the Center for Agri-Food Policy with the Institute for Applied Economic Research (IPEI), RANEPA.
Has Russia always been a grain exporter?

Starting in the 1960s, the USSR was a net grain importer. For example, in 1963, it bought 10.4 million tons of grain and 2.1 million tons of flour from the U.S. Furthermore, the amount of imports gradually increased:
-in 1972, grain imports amounted to 23 million tons;
-in 1975, to 27 million tons;
-in 1979, to 31 million tons;
-in 1980, to 43 million tons.
The record-high amount of grain imports was recorded in 1985, when the USSR had to purchase 47 million tons.

The USSR’s dependence on imported grain became one of the driving factors behind perestroika and economic reforms and, subsequently, the collapse of the Soviet Union. Due to a sharp drop in oil prices in the second half of the 1980s, Soviet authorities did not have enough foreign currency to buy grain and were forced to dramatically increase the amount of foreign borrowing. On the domestic front, the lack of grain led to food shortages and a growing public discontent.
What grain does Russia supply to the global market?

Ripe wheat field from a bird’s eye view.
The most important grain crop in the world is wheat and Russia is now one of the largest wheat suppliers in the world.
“In terms of wheat production, last year Russia became the third largest producer, after India and China,” says Dmitry Bedenkov, head of research at the Russ-Invest investment company.
According to the UN Food and Agriculture Organization, in 2018-2019, Russian wheat production exceeded 72 million tons. In 2017, Russia had a record harvest of 86 million tons.
How much wheat does Russia sell?

Harvesting combines in a wheat field.
According to FAO (the Food and Agriculture Organization of the United Nations), in 2019, Russia was the world’s biggest wheat exporter, selling almost 34.5 million tons.
The other two out of the top three exporters – the U.S. and the EU – are considerably behind the leader, having supplied 26.6 and 23.7 million tons, respectively. Russia exports almost half of its grain production. Since 2013, when its grain exports were slightly under 14 million tons, they have grown by almost 150 percent. The growth can be partly attributed to a rise in world grain prices and an increase in domestic wheat production. In 2012 and 2013, Russia produced 37.8 and 52.14 million tons of wheat, respectively.
Who does Russia sell grain to?

Elevator – agrofirma for the storage and processing of cereals.
According to the Federal Customs Service, in the first six months of 2020, the biggest buyers of Russian grain were Turkey ($818.3 million), followed by Egypt ($514.7 million) and Saudi Arabia ($167.5 million).
In addition, Russia supplies quite significant amounts to:
-Vietnam ($129.8 million),
-Bangladesh ($105.1 million),
-Sudan ($102.4 million),
-UAE ($95.7 million),
-Azerbaijan ($83.5 million),
-Morocco ($77.8 million).

Harvesting combines in a wheat field.
If we look into the amount of grain exports then the list of the top countries in the first half of 2020 would be as follows:
-Turkey (3.9 mln tons),
-Egypt (2.3 mln tons),
-Saudi Arabia (893,000 tons),
-Vietnam (660,000 tons),
-Bangladesh (479,000 tons),
-Sudan (477,000 tons),
-UAE (460,000 tons),
-Azerbaijan (410,000 tones).
-Morocco (368,000 tons).
In the first six months of 2020, Russia exported $3.56 billion worth of grain, 14.3 percent more than in the same period last year. In physical terms, supplies increased even more: by 23.1 percent to 17.3 million tons.
How did Russia manage to achieve these results?

Harvesting combines in a wheat field
The growth in exports was achieved entirely through new production. Domestic grain consumption not only did not decrease due to the increase in exports, but on the contrary, increased: by 10 percent over the past decade.
“The growth in production is primarily due to improvements in agricultural technologies and a resulting increase in yield,” explains Denis Ternovsky. He points out that the growth in Russian grain exports was assisted and made possible by the creation of a logistics infrastructure (port terminals), which made it possible to handle a multiple increase in export volumes, and the devaluation of the ruble, which made Russian wheat more competitive following a drop in world prices after 2014.
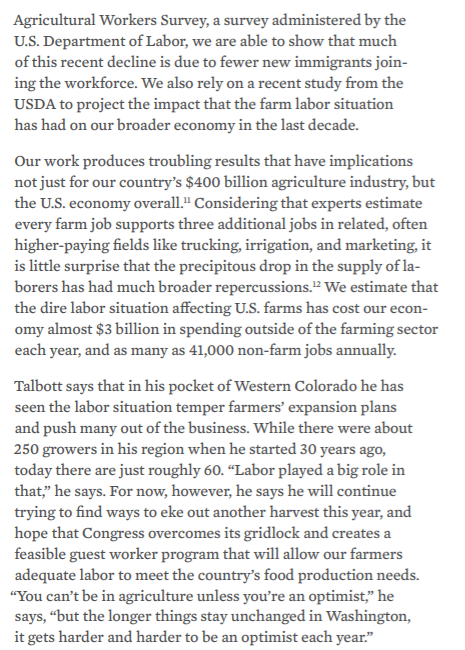
There has been a disturbing trend in agriculture, not only are the number of farms declined, the number of farm laborers is also declining. Farm land is also being bought by overseas conglomerates. What this means for the US, only time will tell.
A Vanishing Breed: How the Decline in U.S. Farm Laborers Over the Last Decade Has Hurt the U.S. Economy and Slowed Production on American Farms


‘They’re Trying to Wipe Us Off the Map.’ Small American Farmers Are Nearing Extinction
For nearly two centuries, the Rieckmann family has raised cows for milk in this muddy patch of land in the middle of Wisconsin. Mary and John Rieckmann, who now run the farm and its 45 cows, have seen all manners of ups and downs — droughts, floods, oversupplies of milk that sent prices tumbling. But they’ve never seen a crisis quite like this one.
The Rieckmanns are about $300,000 in debt, and bill collectors are hounding them about the feed bill and a repayment for a used tractor they bought to keep the farm going. But it’s harder than ever to make any money, much less pay the debt, Mary Rieckmann says, in the yellow-wallpapered kitchen of the sagging farmhouse where she lives with her husband, John, and two of their seven children. The Rieckmanns receive about $16 for every 100 pounds of milk they sell, a 40 percent decrease from six years back. There are weeks where the entire milk check goes towards the $2,100 monthly mortgage payment. Two bill collectors have taken out liens against the farm. “What do you do when you you’re up against the wall and you just don’t know which way to turn?” Rieckmann says, as her ancient fridge begins to hum. Mary, 79, and John, 80, had hoped to leave the farm to their two sons, age 55 and 50, who still live with them and run the farm. Now they’re less focused on their legacy than about making it through the week.
In the American imagination, at least, the family farm still exists as it does on holiday greeting cards: as a picturesque, modestly prosperous expanse that wholesomely fills the space between the urban centers where most of us live. But it has been declining for generations, and the closing days of 2019 find small farms pummeled from every side: a trade war, severe weather associated with climate change, tanking commodity prices related to globalization, political polarization, and corporate farming defined not by a silo and a red barn but technology and the efficiencies of scale. It is the worst crisis in decades. Chapter 12 farm bankruptcies were up 12 percent in the Midwest from July of 2018 to June of 2019; they’re up 50 percent in the Northwest. Tens of thousands have simply stopped farming, knowing that reorganization through bankruptcy won’t save them. The nation lost more than 100,000 farms between 2011 and 2018; 12,000 of those between 2017 and 2018 alone.

The Rieckmann’s mantle in their home in Fremont, Wisconsin, on Nov. 20, 2019.
Farm debt, at $416 billion, is at an all-time high. More than half of all farmers have lost money every year since since 2013, and lost more than $1,644 this year. Farm loan delinquencies are rising.
Suicides in farm communities are happening with alarming frequency. Farmers aren’t the only workers in the American economy being displaced by technology, but when they lose their jobs, they also ejected from their homes and the land that’s been in their family for generations. “It hits you so hard when you feel like you’re the one who is losing the legacy that your great-grandparents started,” said Randy Roecker, a Wisconsin dairy farmer who has struggled with depression and whose neighbor Leon Statz committed suicide last year after financial struggles forced him to sell his 50 dairy cows. Roecker estimates he’s losing $30,000 a month.
Even large companies are facing unprecedented challenges; Dean Foods, a global dairy producer that buys milk from thousands of small farmers, filed for bankruptcy Tuesday, November 12, and is seeking a sale, a move that could further hamper farmers looking for places to sell their milk.
Farmers have always talked of looming disaster, but the duration and severity of the current crisis suggests an alarming and once unthinkable possibility — that independent farming is no longer a viable livelihood. Small farms, defined as those bringing in less than $350,000 a year before expenses, accounted for just a quarter of food production in 2017, down from nearly half in 1991. In the dairy industry, small farms accounted for just 10 percent of production. The disappearance of the small farm would further hasten the decline of rural America, which has been struggling to maintain an economic base for decades.
“Farm and ranch families are facing a great extinction,” says Al Davis, a Nebraska cattle producer and former state senator. “If we lose that rural lifestyle, we have really lost a big part of what made this country great.”

View from the barn into the cow pasture; one of the many farm cats at the entrance to the barn.
A perfect storm of factors has led to the recent crisis in the farm industry. After boom years in the beginning of the 21st century, prices for commodities like corn, soybeans, milk, and meat started falling in 2013. The reason for these lowered prices are the twin forces upending much of the American economy: technology and globalization. Technology has made farms more efficient than ever before. But economies of scale meant that most of the benefits accrued to corporate farmers, who built up huge holdings as smaller farmers sold out. Even as four million farms disappeared in the United States between 1948 and 2015, total farm output more than doubled. Globalization brought more farmers into the international market for crops, flooding the market with soybeans and corn and cattle and milk, and with increased supply comes lower prices. Global food production has increased 30 percent over the last decade, according to John Newton, the chief economist of the American Farm Bureau. If that’s a good thing for feeding the planet, it also reduces what comes back to producers, whose costs don’t fall with prices.
President Trump’s trade war hasn’t helped matters. After the United States slapped tariffs on Chinese goods including steel and aluminum last year, China retaliated with 25 percent tariffs on agricultural imports from the U.S.. China then turned to other countries such as Brazil to replace American soybeans and corn. “This was a market that took years to develop,” says Barb Kalbach, a fourth- generation corn and soybean farmer in Iowa, referring to China. “The president has worked very hard to make our markets unstable.” Her soybeans are harvested and sitting in a grain elevator as she waits to see if China will buy despite the tariffs. Agricultural exports between January and August this year were down 5 percent, or $5.6 billion dollars, from the same period last year. The Trump administration has made $16 billion in aid available to farmers affected by the trade war, though small farmers complain the bulk of the money has gone to huge producers with large crop losses. Around 40 percent of the $88 billion in farm income expected this year is going to come in the form of federal aid and insurance, according to the American Farm Bureau Federation. Farm income absent that assistance, at $55 billion, is down 14 percent since last year and is half of what it was in 2013.
Smaller farms have found it especially hard to adapt to these changes, which they blame on government policy and a lack of antitrust enforcement. The government is on the side of big farms, they say, and is ambivalent about whether small farms can succeed. “Get big or get out,” Earl Butz, Nixon’s secretary of agriculture, infamously told farmers in the 1970s. It’s a sentiment that Sonny Perdue, the agriculture secretary under President Trump, echoed recently. “In America, the big get bigger and the small go out,” Perdue said, at the World Dairy Expo in Wisconsin in October. The number of farms with more than 2,000 acres nearly doubled between 1987 and 2012, according to USDA data. The number of farms with 200 to 999 acres fell over that time period by 44 percent.
Many small American farmers are routinely selling their crops for less than it costs to produce them. “It’s very intimidating, you work hard every day, and every day, it seems like you’re just always struggling,” says Rieckmann.
Prices are so low that farmers like the Rieckmanns are trying to figure out other ways to come up with the money to keep their farm going. But like many other rural areas around the country, their town of Fremont does not have a bustling economy. Both a Kmart and another department store, Shopko, closed in Waupaca county this year, costing dozens of workers their jobs. Mary Rieckmann who will turn 80 in January, got a job delivering newspapers; the family also launched a GoFundMe account. But after Mary crashed her car on a foggy night, her husband and sons convinced her to abandon her paper route. In the past, the family has sold calves to raise extra money, but John recently brought two calves to the stock market and got $20 for one and $30 for another—two years ago, those calves would have brought in $300 to $400 each. “If somebody would have told me 20 years ago what it was going to be like now, I think I would have called him a liar,” Rieckmann says.

A shuttered Mobil Mart in Fremont, Wisconsin, on Nov. 20, 2019.
Heavy rain and unseasonable snow this year have also hurt many Midwestern farmers. This year “has been one of the most significant weather event years,” said John Newton, chief economist of the American Farm Bureau Federation. Portions of Iowa, Nebraska, and Minnesota experienced record flooding this year, with the upper Mississippi River receiving 200 percent more rain and snow than normal. Unusual rain and snow prevented farmers from planting on 19 million acres this year, the most since the USDA began measuring in 2007. Last year, by contrast, weather prevented planting on just 2 million acres.
Mike Rosmann, a clinical psychologist and farmer from Iowa who works with farmers in distress, says that this spring, he got seven calls per week from farmers who were having mental health problems because of their farm’s finances. One farmer called Rosmann to say he was considering suicide — floods destroyed the corn he had already harvested and stored in a grain elevator, but neither crop insurance nor flood insurance would cover it, since he had already harvested the crop. “When that farm is lost, it’s a huge amount of loss of self,” says Scott Marlow, senior policy specialist at the Rural Advancement Foundation, which runs a hotline for farmers in danger of losing their farms. John Hanson, who runs an assistance hotline in Nebraska, says that this year he has gotten calls at midnight from desperate farmers, including one sitting in his kitchen with a loaded shotgun and the lights out.
“It’s very, very bleak for us, and many farmers I know are in the same boat,” said Brenda Cochran, a small dairy farmer in Pennsylvania who says she knows of nine suicides related to low milk prices over the last two years. “It would take a miracle to sustain us for five years.” Farm Aid operates a 1-800 hotline for farmers facing crisis, and calls to that hotline were up 109 percent last year from the year before, says Alicia Harvie, director of Farm Aid’s Advocacy and Farmer Services. The newest farm bill sets aside $50 million over five years for behavioral health supports for distressed farmers.
Rural America has been shrinking for decades, and the Great Recession accelerated that contraction as rural manufacturing jobs disappeared and people moved to cities and suburbs seeking work. That is indeed where the jobs are. Between 2008 and 2017, metropolitan areas that included central cities of at least 50,000 people accounted for 99 percent of all job and population growth, according to data crunched by David Swenson, an economist at Iowa State University. In the Midwest, 81 percent of rural counties saw population declines between 2008 and 2017, and in the Northeast, 85 percent of rural counties shrank over that time period.

Steven Rieckmann loading a bale of hay on Nov. 20, 2019.
Kalbach, the Iowa corn and soybean farmer, says on the square mile of land where she lives, five farm different families used to grow corn, beans, hay, cattle, and pigs. Over the past 15 years, the other four families have given up and moved away. As farmers sold to bigger operations, the local businesses that were dependent on small farmers went belly-up, too. The place where the Kalbachs buy chemicals is now 75 miles away. Her county’s lone pharmacy closed earlier this year. There is no longer a local place where she can get farm equipment repaired. “All the thousands of farmers that have left the land—all the businesses have gone with them,” she says.
So have the institutions that make a community. Around 4,400 schools in rural districts closed between 2011 and 2015, the most recent year for which there is data available, according to the National Center for Education Statistics; suburban districts, by contrast, added roughly 4,000 schools over that same time period. In Wisconsin’s dairy country alone, the Antigo School District, in north central Wisconsin, closed three elementary schools this year, and 44 schools have closed since 2018.
“I used to have a lot of neighbors, now I have almost no neighbors,” says George Naylor, an Iowa corn and soybean farmer who is trying to transition to organic farming to stay afloat.
Cochran is worried about the future of her rural Pennsylvania community as more farmers give up. Two neighbor farm auctions are scheduled soon. The dairy refrigeration supply business where she buys equipment is on the verge of collapse. Young people, seeing economic despair all around them, get out as quickly as they can. “I see this as a wholesale removal — or extermination — of our rural class,” she says.
There’s nothing on the horizon to turn around these rural areas. Americans are increasingly concentrating in a few metropolitan areas — by 2040, 70 percent of Americans will live in 15 states. The regions surrounding America’s family farms may become the country’s next ghost towns. “We have to think about what we really want rural America to look like,” says Jim Goodman, president of the National Family Farm Coalition. “Do we want it to be abandoned small towns and farmers who can’t make a living, and a lot of really big farms that are polluting the groundwater?” (Large farms, which have more animal waste to deal with because of their size, have been found to pollute groundwater and air.)
Most family farmers seem to agree on what led to their plight: government policy. In the years after the New Deal, they say, the United States set a price floor for farmers, essentially ensuring they received a minimum wage for the crops they produced. But the government began rolling back this policy in the 1970s, and now the global market largely determines the price they get for their crops. Big farms can make do with lower prices for crops by increasing their scale; a few cents per gallon of cow’s milk adds up if you have thousands of cows.

Mary Rieckmann on her farm in Fremont, Wisconsin, on Nov. 20, 2019.
Smaller farmers warn that a country without local farmers can create problems in the food supply chain. If one company is providing all the milk or cheese to an entire region, what happens when that plant gets contaminated or a storm isolates it from the rest of the country? “It’s an incredibly fragile supply chain, and when it fails, it fails completely,” says Marlow, of the Rural Advancement Foundation.
Family farmers say concentrating farmland among a few big companies is akin to feudalism, and un-American. It also diverts whatever profits might come from farming to faraway investors, aggravating the economic and geographic divisions that feed the nation’s political divide. “There’s a strong reason to be deeply concerned when instead of having 10 mid-sized dairy farms producing income whose owners spend it in town, you replace that with a large farm owned by a set of investors whose profits go running off to New York and Chicago,” said Peter Carstensen, a professor of law emeritus at the University of Wisconsin law school.
Farmers say the best solution is government policy that cracks down on consolidation of the grocery stores and food processing facilities that buy food from farmers. Existing antitrust law would allow the government to prevent big mergers that mean farmers have fewer places to sell their crops and that supplies are more expensive, but those laws go largely unenforced, says Carstensen. Earlier this year, a Wisconsin congressman introduced legislation to put a moratorium on large food and grocery mergers. Farmers are advocating for better antitrust enforcement across the country; in October, cattle ranchers held a ‘Rally to Stop the Stealin’!’ to urge Congress to protect family farmers from monopoly power, and in Vermont, dairy farmers have filed a lawsuit alleging that a conglomerate of milk buyers conspired to set low prices on milk.
One category of small farmers is thriving in the current marketplace: organic farms who can charge a premium for their crops and who can sell them locally. There were more than 14,000 certified organic farmers in 2016, up 58 percent from 2011. But switching to organic is expensive, and for farmers like the Rieckmanns who are already deeply in debt, not an option. They haven’t gotten a cent of aid from the government, Rieckmann says, since the assistance goes to the farms with the most farmland and animals. They’re not holding their breath that anything will change. “I sometimes feel,” says Mary Rieckmann, “like they’re trying to wipe us off the map.”
The decline of the small American family farm in one chart


Understanding the Economic Crisis Family Farms are Facing
The strain on today’s farm economy is no accident; it’s the result of policies designed to enrich corporations at the expense of farmers and ranchers. If the American family farmer is to survive, farm policy needs a massive shift in direction — one that delivers fair prices to farmers that allow them to make a living.
COVID-19 RAVAGES THE FARM ECONOMY
COVID-19 completely upended our world and is impacting farmers and our food system in several ways. Our country’s entire infrastructure is based on a food system that treats food as a commodity, churning over vast amounts of mass-produced food and fiber to places all over the globe. On top of environmental and public health impacts, our increasingly consolidated food system has shuttered not only independent small and mid-sized farms, but also local processing plants, seed suppliers, grocery chains, equipment dealers and more. In short, the country’s once diverse local and regional foodsheds were systematically erased over time as corporate power in the food system accelerated, leaving us all more vulnerable to something like a pandemic.
As the need for social distancing closed restaurants, schools, processing plants, and other key markets for farmers, drops in demand and supply chain disruptions forced farmers to plow under fields of produce, dump milk and even euthanize animals.[1] For farmers growing crops for biofuels or cotton and other fibers, sharp reductions in demand for fuel and clothing tanked prices for their goods, leaving business plans in tatters.[2] Rising unemployment rates and tightening household budgets continue to constrict food consumption and the prices farmers receive. On top of these challenges are labor shortages, border closures across the globe hampering food transport, and costs of implementing safety measures to protect workers and customers from COVID-19.[3] Snapshots of impacts on farmers so far include:
- Consumers pay more, while farmers get a smaller piece of the pie: Food prices at grocery stores are up 5.6% from a year ago, the largest increase in nearly a decade, while farmgate prices have dropped by 4.8%. In some cases, the contrast is severe: beef prices are 25% higher than a year ago, even while livestock prices for farmers fell by 17%. Price fixing by a handful of major meatpackers may be driving this problem. Today, farmers receive an average 14.6 cents for every dollar consumers spend on food.[4]
- Dairy farms on the edge: Dairy farmers have been rocked by low prices over the last several years, and 2020 set them on a rollercoaster. In January, Class I milk prices were at $19.01 per hundredweight (cwt), hovering several dollars below the cost of production for most dairy farmers. By June 2020, prices plummeted by 40% to $11.42/cwt, an untenable level that shuttered hundreds of dairies for good. Today, while milk prices are back up, they are still far below the cost of production, causing dairy farmers to lose money every time they milk their cows.[5] In dairy dependent states that have lost thousands of local dairies over the last few years, many worry that this fall will bring a wave of foreclosures that permanently alters their rural communities.
- Local farmers left out: Despite rising demand for local food during the pandemic, the closure of farmers’ markets, schools and other critical outlets had dramatic impacts not only on local farmers’ income, but on their costs. One economic analysis estimated a decline of up to $688.7 million in sales across key local and regional markets from March to May 2020, leading to up to $1.32 billion in total loss to the economy from March to May 2020.[6] This particularly harms smaller, socially disadvantaged, and beginning farms and the markets they serve. Unfortunately, federal relief programs have tended to leave out these growers, delivering the lion’s share of support to the very largest farms.
- Bad news for beef and hog producers: By late August, at least 772 meatpacking and food processing plants reported cases of COVID-19, with at least 56,510 workers testing positive and hundreds dying from the illness. Several reports indicate meatpacking workers were forced to work without adequate protection, while major meatpacking companies received federal relief money from the CARES Act.[7] Due to forced closures, beef and pork processing plants slowed by 25% and 40%, respectively,[8] plummeting prices and leaving farmers stuck with animals they could not process. Hog farmers are forecast to lose $5 billion in 2020, equating to a loss of $37 per head, while the beef industry anticipates $13.6 billion in economic damage, with ranchers losing well over $100 per head.[9][10]
An April 2020 report predicts that COVID-19 will cost farmers $20 billion in net farm income this year,[11] while a survey conducted in May 2020 estimated that nearly a third of small, independent farms would close down by the end of the year.[12] But without an end to the pandemic in sight, it is still too early to capture its full damage to the farm economy.
EVEN BEFORE COVID-19, FARM FAMILIES HAD NEGATIVE FARM INCOME
Things have been bad in farm country for a while. Between 2013 and 2018, farmers experienced a nearly 50% drop in net farm income as the prices for corn, wheat, dairy, beef and other farm products crashed. While net farm income rose by 3% in 2019, government payments accounted for all of that increase (namely, via the trade bailout program). Without it, 2019 delivered farmers their second lowest income since 2013.[13]
As for 2020, while the U.S. Department of Agriculture (USDA) is forecasting a $19 billion (or 22.7%) increase in net farm income this year, government payments like trade bailouts and federal COVID-19 relief programs account for 36% of net farm income — the highest share since 2001 and the eighth highest share since The Great Depression.[14] Without the $22.4 billion provided in government payments, net farm income in 2020 would be well below the sector’s average from 2000 to 2019.[15] What’s more, the vast majority of payments flowed to the very largest farms. CNBC reports that the top 5% of trade bailout recipients received nearly half of all $28 billion paid in 2018 and 2019.[16]
Perhaps more troubling is USDA’s pre-pandemic data. In February, USDA forecast 2020 median farm household income at -$1,840 — meaning that farm households would lose money from the farm.[17] More recent USDA data suggests a slightly better median income level,[18] presumably from high levels of government payments. But even these sector-wide income numbers likely mask severe distress in many parts of farm country, as many farmers who have been squeezed by years of low income did not benefit from federal payments. Most farmers rely on off-farm jobs to feed their families, secure health insurance, and keep their farms afloat. Given the pandemic’s broader economic impacts, which arrived after farmers have had to dig into their savings for the better part of the last decade, droves of farms are at risk of going under in the next year.
FARM CREDIT CONDITIONS WEAKEN
Farmers rely heavily on credit to buy the seeds, fertilizer, machinery, livestock and other inputs that keep their farms running. Because most farmers require operating loans at the start of each season, a critical aspect of a farm’s financial health relates to its ability to make loan payments on time. Economists utilize various solvency measures to measure this, including the debt-to-asset ratio, debt-to-equity ratio and equity-to-asset ratio. All of these measured weakened for the eighth consecutive year in 2020. As farm debt continues to rise, the sector’s risk of insolvency in 2020 is at its highest level since 2002.[19] The following trends reveal weakening credit conditions for farmers and ranchers in today’s strained economy:
- Farmers struggle to make loan payments. Farm loan delinquency rates are rising. The Federal Reserve Bank of Kansas City, which covers Colorado, Kansas, Missouri, Nebraska, New Mexico, Oklahoma and Wyoming, reports that the volume of delinquent farm real estate and operating loans increased by about 17% and 13%, respectively, over the past year.[20] Meanwhile, the Federal Reserve Bank of Chicago, covering Illinois, Indiana, Iowa, Michigan and Wisconsin, reports the share of farm loans with “major” or “severe” repayment problems is now at 8.3% — a level not seen since 1988.[21]
- The 1980s all over again? Pre-COVID-19, total farm debt was estimated to hit a record $425 billion, just shy of the 1981 peak of $440 billion.[22] Since 2014, real estate debt has been rising to historic levels, potentially indicating not just rising land values, but farmers refinancing higher-interest loans or other debt into farm real estate. In a time of persistently low farm income where farmers are defaulting on loans, this trend places a lot of farmland at risk of liquidation.[23]
- Growing demand for credit: If farmers can’t secure affordable and timely credit, they face an economic uncertainty that threatens the survival of their farms. Several bankers are reporting growing demand for loans, yet significant decreases in both the number and the size of agricultural loans in their portfolios.[24]
While economists and lenders note that federal relief has helped farmers navigate these conditions, many remain concerned that without more intervention, a wave of foreclosures will strike farm country. These conditions are challenging for all farmers, but beginning farmers, smaller and midsized farmers, as well as other disadvantaged farmers in particular continue to struggle.
BANKRUPTCIES TICK UP IN KEY SECTORS
Faced with multiple years of losses that have whittled away equity, many farmers are making hard choices. Many are selling off land, livestock or equipment in an effort to hold on. Others are finding off-farm jobs to supplement farm income, only to see those jobs go away. Some farmers are choosing to retire early, while others are declaring bankruptcy in an effort to keep their farm. These tough choices are raising concerns that we are on the cusp of a slow but huge wave of farm losses not seen since the 1980s.
Chapter 12 bankruptcy was created during the 1980s Farm Crisis specifically for family farmers and fisherman and offers one indicator of extreme stress in the farm sector. Because most farmers who are in crisis do not end up filing a Chapter 12, bankruptcy data is really just the tip of the iceberg that contains much larger number of farms in crisis.
By June 2020, Chapter 12 bankruptcy filings totaled 580, representing an 8% rise from June 2019 levels.[25] The largest increases in bankruptcies came from the Midwest (23%), Northwest (70%) and Southeast (22%), with more than half of filings occurring in the Midwest alone over the last year. Wisconsin, the country’s second largest dairy state, had the country’s highest number of Chapter 12 filings (69) between July 2019 and June 2020, followed by Nebraska (38), Georgia (36), Minnesota (36), Iowa (33) and Kansas (32). In total, 23 states saw bankruptcy filings rise over the last 12 months, with the biggest increases occurring in Wisconsin, Oregon and Iowa.[26]
RISING STRESS IN RURAL AMERICA
America’s farmers and ranchers are pillars of their communities and the foundation of their local economies. When farmers do better, we all do better — and the opposite is also true. The farm economy has a disproportionate effect on farming-dependent counties, which accounted for nearly 20% of all rural counties and 6% of the rural population in 2017.[27] As farmers are forced into bankruptcy or foreclosure, a ripple effect on equipment dealers, input manufacturers and local purchasers and processors further taxes rural economies. In 2019, the combination of depressed farm prices and punishing weather conditions left many farmers unable to plant and caused a documented strain on Midwestern farm economies, particularly those dependent on corn and soybean production.[28] Today’s pandemic provides farmers with little ability to bounce back from a challenging set of years, and is pushing many farm businesses past the point of no return.
As the farm economy continues to falter, signs of stress are rising among farmers. So far in 2020, Farm Aid has seen a 27% increase in contacts to our farmer hotline, a majority from farmers in crisis who exhibit acute signs of stress. Farm Aid has worked to bring awareness to the issue of farm stress and advocated for increased federal resources to address the challenge of caring for the mental health of rural residents, farmers and those working in agriculture. Farm Aid is working to show farmers they are not alone, and there is help. In fact, managing farm stress is just as important as managing the farm.
Conditions today are different than in the 1980s Farm Crisis that led to foreclosures rapidly spreading nationwide. This crisis is happening slowly, negative income year by negative income year. But the outcome will be the same: extensive loss of family farms and a growing threat to rural wellbeing and prosperity. Without strident emergency measures paired with visionary farm policies that set us on a better course, America faces the extinction of the family farm and the social and economic gutting of rural communities.
FARM POLICY SOLUTIONS
All too often, food is treated like any other commodity and farming like any other profession. This could not be further from reality. While many blame the current economic downturn on the oversupply of major commodities, the real root cause is failed policy. If we’re going to save the family farm, we need policies that support the success of small and midsized farmers and the communities they call home — not the profits of multinational companies.
In short, without sound policies, it is nearly impossible for farmers to consistently make a good living from the land.
FAIR PRICES AND PARITY
Agriculture doesn’t fit neatly into conventional economic models. As a sector, farming is relatively inelastic, with farmers and eaters both unable to alter their consumption or production dramatically in any given year. People must eat, and what they eat only shifts marginally in a given period of time, no matter how much farmers produce. Farmers, meanwhile, almost always have an incentive to produce as much as possible to squeeze a profit from their land and build a cushion for the tough times that will inevitably come. The greater the supply of a particular crop on the market, the lower the price drops. Since consumers buy more or less the same amount of food from week to week, a farmer can actually make less money when production is high.
There are many ways we can secure fair farm prices. Historically this has been achieved through a combination of supply management programs like grain reserves, and by setting floor prices — comparable to the minimum wage for other jobs. These programs ensure that the people who grow our food can at least recover their cost of production for the goods they produce. Many have advocated for parity pricing for farmers, which helps them recover their cost of production plus a little more — so they don’t just break even, but actually make a profit. The idea of parity pricing is comparable to the concept of living wages.
FARMERS NEED EQUITABLE ACCESS TO CREDIT AND FAIR TRADE
Affordable credit is essential for farmers, who have to spend money to plant their crops and care for their animals months before they reap a financial benefit. While there have been many important improvements in farm credit policy at the federal level, there is still much work needed to ensure that farmers of all kinds can secure the credit they need to thrive on the land.
Historically, there have been inequities in who can access agricultural financing. Beginning farmers, organic farmers or those engaged in diversified production or more local and regional markets have often struggled to secure credit or find loan packages that make sense for their farms. In addition, there is a long history of racial discrimination at USDA Farm Service Agency offices (something the last Administration took strides to rectify), where Black, Latino, Native American and other socially disadvantaged farmers were denied the loans needed for their farms, ultimately leading to dispossession of their land.
Farm Aid also supports food sovereignty, the right of communities and nations to determine their own food and agriculture policies and the broader democratization of food and farming systems. Opening up trade through free trade agreements, especially when large corporations write the rules, often leads to weakening hard-fought environmental protections, worker protections, food safety standards and financial regulations. Far too often, our rural communities are hit hard as trade deals undermine supply control and price support policies that intend to keep prices stable for family farmers.
Trade deals should not undermine the food sovereignty of farmers and eaters here and abroad. Instead, trade with foreign nations should strengthen our economy and create jobs, while preserving the environmental, labor, health and safety standards that Americans depend upon.
REINING IN CORPORATE CONTROL
A handful of corporations control our food from farm to fork. Their unbridled power grants them increasing political influence over the rules that govern our food system and allows them to manipulate the marketplace, pushing down the prices paid to family farmers and driving them out of business. Below are some of the policies Farm Aid advocates for to rein in corporate power in our food system:
- Enforce America’s antitrust laws, including the Sherman Antitrust Act, Clayton Antitrust Act and Packers and Stockyards Act.
- Stop mega mergers occurring throughout the food and agricultural sector.
- Enact comprehensive pricing reform in the dairy industry and expose corporate price manipulation. Institute supply management programs to stop the overproduction of milk.
- Reissue and finalize the USDA Farmer Fair Practice Rules to increase market transparency, establish fair contracts and protect the First Amendment rights of livestock and poultry growers.
- Reform federal checkoff programs that tax cattle ranchers, hog producers, dairy farmers and other farmers on their goods in order to fund marketing campaigns that benefit corporations.
- Reinstate Country of Origin Labeling (COOL) and other programs that increase transparency in the food system and allow eaters to support American farmers and ranchers.
- Preserve local control laws and defend the rights of local communities to stop the creation or expansion of factory farms that threaten their air, water, soil and quality of life.
- Advance food sovereignty and limit the role corporations can play in writing our trade deals.
WHAT FARM AID IS DOING
Farm Aid started in the midst of the 1980s Farm Crisis, a time when the farm economy contracted severely and pushed hundreds of thousands of family farmers off the land. The core strategies of Farm Aid’s work that emerged during that time — raising awareness, providing support for farmers in crisis and advocating for policies to create a more fair and just agricultural system — have remained to this day.
Farm Aid works with local, regional and national organizations to promote fair farm policies and grassroots organizations coordinating campaigns designed to defend and bolster family farm-centered agriculture. We’ve worked side by side with farmers to protest factory farms and inform farmers and eaters about issues like genetically modified food and growth hormones. By strengthening the voices of family farmers, Farm Aid stands up for the people who we all depend on. Our Action Center allows concerned citizens to become advocates for farm policy.
In response to the pandemic, Farm Aid launched the Farmer Resilience Initiative, working with more than 120 local, state and regional organizations across the country to pair immediate relief efforts with longer-term resilience strategies. Farm Aid is proud to invest in our farm and food system, from farm to plate, and take care of the farmers and ranchers who are providing essential services by feeding their communities.
We continue to amplify stories we hear from farmers over our hotline and through our partners to highlight the urgent need to bolster our nation’s farm economy; we’re advocating for critical emergency measures to support farmers immediately; and we’re working to secure long-term policies that provide farmers with fair prices and fair, competitive markets. We also are strengthening our Farm Aid hotline, resource network and Farm Advocate Link, a national network of Farm Advocates who work with farmers to increase their ability to stay on the land and succeed.
Conclusion
There appears to a be a myriad of reasons that the US no longer reigns supreme in agriculture. One is that there are fewer people farming and fewer workers available. Maybe that is the reason, we are allowing so many immigrants to enter our southern borders. Immigrants over the generations have typically either entered into the industrial labor force or into the farming labor force. While the number of family farms is decreasing, so too is the total amount of land being used. Our farms are now being run by large conglomerates. So when one is bought out, it effects our country. China now owns over 190,000 acres of farmland in the US. Bill Gates and other billionaires own several hundred thousand more acres. What does this mean? As I stated only time will tell. With less land producing more food, the land is being strained to the breaking point. We all know that our industrial and manufacturing sector is shrinking. This means we are becoming more and more dependent on other countries for a lot of our basic needs. Some of these countries are less than friendly towards us. I for one did not know that we now get most of our fertilizer from Russia. Without fertilizers our land is limited to just a couple of cycles before it is no longer usable for growing crops. I used to live in Florida, where I know we had enormous reserves of organo-phosphates and nitrates which are the main ingredients in fertilizers, so I am not sure why we are now getting it from Russia? Just a little side note, we buy our cement from China. What the hell? Limestone is the major ingredient in cement. We have enough limestone in the US to pave most of the world. So this should come as no surprise that we are now dependent on Russia for such a critical element in our food chain. So I guess we only have ourselves to blame with the state that our agriculture has fallen in. I know with our Woke president, we will receive little help, so all we can do is hope that our next president will deal with some of the crises that we are getting hammered with. With the price of fossil fuels reaching new heights we can be assured that more belt tightening is just around the corner.
Resources
insidermonkey.com, “8 Countries that Produce the Most Grain in the World.”; jswconline.org, “Economic and environmental impacts of the corn grain ethanol industry on the United States agricultural sector.” By J.A. Larson, B.C. English, D.G. De La Torre Ugarte, R.J. Menard, C.M. Hellwinckel and T.O. West; connectusfund.org, “19 Major Pros and Cons of Corn Ethanol.” By Editor in Chief; investopedia.com, “The World’s 6 Biggest Corn Producers.” By Carol M. Kopp; world-grain.com, “Focus on the United States.” By Chris Lyddon; rbth.com, “How Russia became the world’s LEADING wheat exporter.” By Alexei Lossan; research.newamericaneconomy.org, “A Vanishing Breed: How the Decline in U.S. Farm Laborers Over the Last Decade Has Hurt the U.S. Economy and Slowed Production on American Farms.” By Stephen G. Bronars, PhD.; time.com, “‘They’re Trying to Wipe Us Off the Map.’ Small American Farmers Are Nearing Extinction.” By Alana Semuels; farmland.org, “New Census of Agriculture Shows Decline in Number of America’s Farms, Farmers, and Farmland.” By Jennifer Dempsey; washingtonpost.com, “The decline of the small American family farm in one chart.” By Roberto A. Ferdman; farmaid.org, “Understanding the Economic Crisis Family Farms are Facing.”;
Addendum


Focus on the US
In 2019
The United States is the world’s largest grain producer and exporter and its biggest ethanol producer. Recent trade disagreements, however, have complicated life for U.S. exporters, particularly of soybeans, as the U.S. and Chinese governments fight over issues that go much wider than agricultural trade.
In its May 30 Grain Market Report, the International Grains Council (IGC), forecast total U.S. grains production in 2019-20 at 426.2 million tonnes, down from the prediction it made earlier this year of 434.8 million and compared with 431.6 million in 2018-19.
The IGC now puts U.S. wheat output in 2019-20 at 50.3 million tonnes, a forecast unchanged from a month earlier and down from 51.3 million in the previous year.
U.S. corn production is now forecast at 362.4 million tons in 2019-20, down from the 371.2 million predicted a month earlier. The previous year’s crop was 366.3 million tons.

Barley production in the United States in 2019-20 is forecast at 3.4 million tons, a figure unchanged from the previous month’s forecast. The 2018-19 crop was 3.3 million tons.
Production of sorghum is put at 8.5 million tons, a forecast unchanged from the month before, down from 9.3 million in 2018-19.
Total U.S. grain exports in 2019-20 are forecast at 84.8 million tons, down from the figure of 88 million the IGC predicted a month earlier and also down from the previous year’s 90.2 million tons.
U.S. wheat exports are forecast at 26 million tons in 2019-20, a downward revision from the figure of 27.1 million tons arrived at a month earlier, and also down from the 26.5 million tons exported in 2018-19.
U.S. exports of corn are forecast at 55.9 million tons, down from the forecast made the previous month of 57.9 million and also down from the 60.9 million tons exported in 2018-19.
Total U.S. grain imports in 2019-20 are forecast at 6.3 million tons, up from the previous estimate of 5.9 million tons and up from 5.7 million tons last year.
U.S. imports of wheat are forecast at 3.1 million tons, an estimate revised up from the figure of 2.8 million tons produced the month before, and up on the 3 million tons imported in 2018-19.
The forecast for U.S. corn imports in 2019-20 is unchanged at 1.1 million tons and compares with a figure of 800,000 tons for the year before.
The United States is also set to export 2.75 million tons of sorghum in 2019-20, according to the IGC, which had revised its forecast down by 50,000 tons. The previous year’s exports were 2.8 million. Imports are too small to register in the IGC’s predictions.
The IGC’s forecast for U.S. rice production is unchanged at 6.9 million tons, down from 7.1 million the year before. U.S. imports of rice are put at 800,000 tons, down from the previous estimate of 900,000 and the same as the previous year’s level. U.S. exports of rice are forecast at 3.3 million tons, down from 3.4 million forecast a month earlier, but up from the previous year’s 3 million tons.

The IGC’s forecast for the U.S. soybean crop is unchanged at 114 million tons, down from 123.7 million the year before. U.S. rapeseed production is put at 1.5 million tons, down from the previous estimate of 1.6 million and 1.6 million the previous year.
U.S. soybean exports are put at 52.9 million tons, down from the previous forecast of 53.5 million, but up from 49.3 million the year before. The country’s exports of soymeal are put at 12.3 million tons, up from the previous estimate of 11.6 million tons and down from 12.5 million in 2018-19.
U.S. imports of rapeseed are put at 500,000 tons, unchanged from the previous estimate and the previous year’s crop. U.S. rapeseed exports are put at 200,000 tons, an unchanged climate that compares with the previous year’s exports of 100,000.
Trade war with China
U.S. trade in grains and oilseeds has been disrupted by a series of disputes, notably with China, to the dismay of the country’s farmers. On June 11, Ben Scholz, president of the National Association of Wheat Growers, submitted testimony to the House Agriculture Livestock and Foreign Agriculture Subcommittee telling the politicians that “wheat farmers are facing an incredibly challenging economic environment and that trade disruptions have negatively impacted farmers.”
The U.S. administration’s dispute with China, which resulted in that country effectively blocking imports of U.S. soybeans, has had, perhaps, the most disruptive effect. The American Soybean Association on May 13 criticized “the lack of progress between the U.S. and China in resolving the trade war, which continues to immediately threaten soy prices and, if not resolved, farmers’ ability to stay in business.”
“The U.S. has been at the table with China 11 times now and still has not closed the deal,” said Davie Stephens, president of the ASA. “What that means for soybean growers is that we’re losing. Losing a valuable market, losing stable pricing, losing an opportunity to support our families and our communities.”
Flour milling
According to the 2019 Grain and Milling Annual, there were 164 mills in the United States in 2018, four fewer than in 2017. They have a total daily capacity of 1,579,036 cwts (71,624 tons). Seventy-two of the mills have a capacity of 10,000 cwts (454 tons) per day or more, while just 10 have a capacity of under 200 cwts (nine tons).
The largest mill in the United States is that of the North Dakota Mill & Elevator Association at Grand Forks, North Dakota, with a daily capacity of 52,500 cwts (2,381 tons), putting it far ahead of the second largest, the Ardent Mills mill at Hastings, Minnesota, which has a daily capacity of 32,500 cwts (1,474 tons).
However, Ardent Mills is the largest milling company, with a combined milling capacity of 496,800 cwts (22,534 tons), which includes rye and durum.
Biotech and biofuels
The United States has been an enthusiastic adopter of biotech in agriculture, particularly for soybeans and corn. According to the USDA’s Economic Research Service, 92% of corn planted in the United States in 2018 was stacked gene varieties, while 94% of soy was also genetically engineered.
On June 11, President Donald Trump signed an order calling for a streamlined regulatory system for biotech products and action against trade barriers. The Modernizing the Regulatory Framework for Agricultural Biotechnology Products Executive Order also says the regulatory system “must both foster public confidence in biotechnology and avoid undue regulatory burdens.”
The United States is the world’s largest producer of fuel ethanol, using, overwhelmingly, corn as a feedstock. In its 2019 Ethanol Industry Outlook, the Renewable Fuels Association said that, in 2018, “the nation’s 210 ethanol plants located across 27 states produced an astounding 16.1 billion gallons of clean-burning renewable ethanol.”
A move to legalize the year-round use of an E15 blend, finalized May 31, is expected to increase ethanol consumption.
New Census of Agriculture Shows Decline in Number of America’s Farms, Farmers, and Farmland
The 2017 Census of Agriculture released yesterday shows an across-the-board drop in the number of farms, farmers, and farmland in the United States. Land in farms declined from 914,527,657 acres in 2012 to 900,217,576 acres in 2017, while the number of farms and “primary producers” decreased from 2,109,303 in 2012 to 2,042,220 in 2017. This news has serious implications for food production, our environment, and the next generation of farmers.
As with each Census of Agriculture, American Farmland Trust starts our analysis with the land. Farmland and ranchland are the critical infrastructure—the same as our roads, bridges, and highways—upon which agriculture depends. Next, we always take a deep dive to look at who farms the land because AFT recognizes that without the farmers there is no agriculture. Here are a few key takeaways we’ve seen so far:
Land in Farms
- Fewer acres of land in farms: Down 14,310,081 acres (a two percent drop)
- Most states saw a decline: 34 states experienced a reduction in land in farms
- Biggest acre losses: Texas, New Mexico, Montana, Wyoming and California
- Largest percentage decreases: Rhode Island, Connecticut, New Hampshire, Maine, Massachusetts—four of the five reported double-digit percentage decreases
- Little change in share of land devoted to agriculture: Land in farms hovers at 40 percent of the nation’s land area
- The good news is complicated: 16 states experienced upticks in land in farms amid the nationwide decline. We’ll be looking to see if increases in land in farms coincide with increases in the number of farms, producer, or beginning producers.
Farmers (i.e., Producers)
In the 2017 Census of Agriculture, USDA’s National Agricultural Statistics Service, or NASS, changed the way it reports on individuals’ roles in farm operations to do a better job capturing their contributions. This led to more people being identified as “producers,” (which now replaces “operators” in Census lingo) and a jump in the number of beginning producers. But despite the apparent growth in new and beginning producers, all producers are getting older, and the number of young producers inched up less than two percent. Highlights include:
- More producers (equivalent to all operators): Up 6.9 percent from 2012 to 3,399,834
- Fewer primary producers (comparable to principal operators): Down from 2,109,303 in 2012 to 2,042,220 in 2017
- Beginners are on the rise: The 908,274 new and beginning producers based on 10 year or less of experience on any farm who now account for 26.7 percent of all producers and the 472,360 new and beginning primary producers based on 10 years or less of experience on any farm represent 23.1 percent of all primary producers. It’s hard to make direct comparisons to 2012 because NASS used different experience ranges and sometimes only counted experience on the operator’s present farm (versus any farm). But another current measure of new and beginning producers based on less than 10 years of experience on their present farm counted 510,536 new and beginning producers among primary producers, up a healthy 9 percent from a comparable number in 2012.
- Beginners still come in all ages: 32 percent of all new and beginning producers are 55 and older
- Farmers are aging: The average age of all producers climbed to 57.5 years and the average age of primary producers hit 59.4
- The proportion of senior farmers is growing: There are more than six times as many primary producers age 65 and older as primary producers 34 and younger
- Slight uptick in primary producers: Producers 34 and younger inched up from 119,833 in 2012 to 121,754 in 2017
Farms Under Threat
Here’s something else to keep in mind: The census doesn’t track what happens to land that is no longer counted as part of a farm or how land was used prior to being identified as part of a farm. This means that decreases in land in farms don’t equal conversion, and gains can happen in places where farmland and ranchland is being lost to development. This can be confusing and make people think we don’t have a problem. AFT launched Farms Under Threat, an analysis of the location, quantity, type, and quality of agricultural land lost to development, to help people understand what’s happening to our farmland. We’ll use new data from the census to inform our spatial analyses.
This is our first take on the 2017 Census of Agriculture. AFT’s Farmland Information Center will dig into the census data over the coming weeks and release additional posts. In the meantime, thank you to the farmers who responded to the census and the staff at NASS who collected, analyzed, and published this snapshot of U.S. agriculture in 2017.