


I started this current series to discuss what is wrong with our country and what we need to do to fix it. While I have discussed some of the topics that I will be including in this series, they have been included in other articles. In this series I will concentrate on a single topic. This will also mean that some of the articles may be slightly shorter than my readers have grown accustomed to, however they will still be written with the same attention to detail. This series will have no set number of articles and will continue to grow as I come across additional subjects.
Welfare is defined as the
- statutory procedure or social effort designed to promote the basic physical and material well-being of people in need.” the protection of rights to education, housing, and welfare”
Welfare, or commonly social welfare, is a type of government support intended to ensure that members of a society can meet basic human needs such as food and shelter. Social security may either be synonymous with welfare, or refer specifically to social insurance programs which provide support only to those who have previously contributed (e.g. most pension systems), as opposed to social assistance programs which provide support on the basis of need alone (e.g. most disability benefits). The International Labor Organization defines social security as covering support for those in old age, support for the maintenance of children, medical treatment, parental and sick leave, unemployment and disability benefits, and support for sufferers of occupational injury.
More broadly, welfare may also encompass efforts to provide a basic level of well-being through free or subsidized social services such as healthcare, education, vocational training, and public housing. In a welfare state, the state assumes responsibility for the health, education, and welfare of society, providing a range of social services such as those described.
The first codified universal government welfare was instituted in the 7th century (634 CE) in the time of the Rashidun caliph Umar. The first welfare state was Imperial Germany (1871–1918), where the Bismarck government introduced social security in 1889. In the early 20th century, the United Kingdom introduced social security around 1913, and adopted the welfare state with the National Insurance Act 1946, during the Attlee government (1945–51). In the countries of western Europe, Australia, and New Zealand, social welfare is mainly provided by the government out of the national tax revenues, and to a lesser extent by non-government organizations (NGOs), and charities (social and religious). A right to social security and an adequate standard of living is asserted in Articles 22 and 25 of the Universal Declaration of Human Rights.
In the Roman Empire, the first emperor Augustus provided the Cura Annonae or grain dole for citizens who could not afford to buy food every month. Social welfare was enlarged by the Emperor Trajan. Trajan’s program brought acclaim from many, including Pliny the Younger. The Song dynasty government (960 CE) supported multiple programs which could be classified as social welfare, including the establishment of retirement homes, public clinics, and paupers’ graveyards. According to economist Robert Henry Nelson, “The medieval Roman Catholic Church operated a far-reaching and comprehensive welfare system for the poor …” From the 14th century onward the governments of the Italian city-states began to partner with the church to provide welfare and education to the lower classes. In later Protestant European nations such as the Dutch Republic welfare was managed by local guilds until the abolition of the guild system in the early 19th century. In the free imperial cities of the Holy Roman Empire the city governments in cities like Nuremberg could take control of the collection and distribution of public welfare.
The 7th century caliph Umar implemented a form of zakat, one of the Five Pillars of Islam, as a codified universal social security tax. Traditionally estimated at 2.5% of an individual’s assets, government zakat funds were distributed to various groups of Muslims, including impoverished people and those in severe debt. The collection of zakat increased during the Umayyad and Abbasid caliphates, though the zakat system was frequently inefficient and corrupt; Islamic jurists often instructed Muslims to distribute money to the needy directly instead to maximize its impact.
Likewise, in Jewish tradition, charity (represented by tzedakah) is a matter of religious obligation rather than benevolence. Contemporary charity is regarded as a continuation of the Biblical Maaser Ani, or poor-tithe, as well as Biblical practices, such as permitting the poor to glean the corners of a field and harvest during the Shmita (Sabbatical year).
There is relatively little statistical data on transfer payments before the High Middle Ages. In the medieval period and until the Industrial Revolution, the function of welfare payments in Europe was achieved through private giving or charity, through numerous confraternities and activities of different religious orders. Early welfare programs in Europe included the English Poor Law of 1601, which gave parishes the responsibility for providing welfare payments to the poor. This system was substantially modified by the 19th-century Poor Law Amendment Act, which introduced the system of workhouses.
It was predominantly in the late 19th and early 20th centuries that an organized system of state welfare provision was introduced in many countries. Otto von Bismarck, Chancellor of Germany, introduced one of the first welfare systems for the working classes. In Great Britain the Liberal government of Henry Campbell-Bannerman and David Lloyd George introduced the National Insurance system in 1911, a system later expanded by Clement Attlee.
Modern welfare states include Germany, France, the Netherlands, as well as the Nordic countries, such as Iceland, Sweden, Norway, Denmark, and Finland which employ a system known as the Nordic model. Esping-Andersen classified the most developed welfare state systems into three categories; Social Democratic, Conservative, and Liberal.
A report published by the ILO in 2014 estimated that only 27% of the world’s population has access to comprehensive social security. The World Bank‘s 2019 World Development Report argues that the traditional payroll-based model of many kinds of social insurance are “increasingly challenged by working arrangements outside standard employment contracts”.[29]
Welfare can take a variety of forms, such as monetary payments, subsidies and vouchers, or housing assistance. Welfare systems differ from country to country, but welfare is commonly provided to individuals who are unemployed, those with illness or disability, the elderly, those with dependent children, and veterans. Programs may have a variety of conditions for a person to receive welfare:
- Social insurance, state-sponsored programs based partly on individual contributions towards benefits such as healthcare, unemployment payments, and old-age pensions.
- Means-tested benefits, financial assistance provided for those who are unable to cover basic needs, such as food, clothing and housing, due to poverty or lack of income because of unemployment, sickness, disability, or caring for children. While assistance is often in the form of financial payments, those eligible for social welfare can usually access health and educational services free of charge. The amount of support is enough to cover basic needs and eligibility is often subject to a comprehensive and complex assessment of an applicant’s social and financial situation. See also Income Support.
- Non-contributory benefits. Several countries have special schemes, administered with no requirement for contributions and no means test, for people in certain categories of need: for example, veterans of armed forces, people with disabilities and very old people.
- Discretionary benefits. Some schemes are based on the decision of an official, such as a social worker.
- Universal or categorical benefits, also known as demogrants. These are non-contributory benefits given for whole sections of the population without a means test, such as family allowances or the public pension in New Zealand (known as New Zealand Superannuation). See also the Alaska Permanent Fund Dividend.
Social protection
In developing countries, formal social security arrangements are often absent for the vast majority of the working population, in part due to reliance on the informal economy. Additionally, the state’s capacity to reach people may be limited because of its limited infrastructure and resources. In this context, social protection is often referred to instead of social security, encompassing a broader set of means, such as labor market intervention and local community-based programs, to alleviate poverty and provide security against things like unemployment.
In the United States, depending on the context, the term “welfare” can be used to refer to means-tested cash benefits, especially the Aid to Families with Dependent Children (AFDC) program and its successor, the Temporary Assistance for Needy Families block grants, or it can be used to refer to all means-tested programs that help individuals or families meet basic needs, including, for example, health care through Medicaid, Supplemental Security Income (SSI) benefits and food and nutrition programs (SNAP). It can also include social insurance programs such as unemployment insurance, Social Security, and Medicare.
AFDC (originally called Aid to Dependent Children) was created during the Great Depression to alleviate the burden of poverty for families with children and allow widowed mothers to maintain their households. The New Deal employment program such as the Works Progress Administration primarily served men. Prior to the New Deal, anti-poverty programs were primarily operated by private charities or state or local governments; however, these programs were overwhelmed by the depth of need during the Depression. The United States has no national program of cash assistance for non-disabled poor individuals who are not raising children.
Until early in the year 1965, the news media conveyed the idea that only whites lived in poverty, but then Blacks were presented more often than Whites in this plight. Some of the influences on this shift may have been the civil rights movement and urban riots from the mid 60s. Welfare had by then shifted from being a White issue to being a Black issue and during this time frame the war on poverty had already begun. Subsequently, news media portrayed stereotypes of Blacks as lazy and undeserving and as welfare queens. These shifts in media presentation didn’t necessarily reflect a decrease in the percentage of the population living in poverty.
A chart showing the overall decline of average monthly welfare benefits (AFDC then TANF) per recipient 1962–2006 (in 2006 dollars).
In 1996, the Personal Responsibility and Work Opportunity Reconciliation Act changed the structure of Welfare payments and added new criteria to states that received Welfare funding. After reforms that President Clinton said would “end Welfare as we know it”, amounts from the federal government were given out in a flat rate per state based on population. Each state must meet certain criteria to ensure recipients are being encouraged to work themselves out of Welfare. The new program is called Temporary Assistance for Needy Families (TANF). It encourages states to require some sort of employment search in exchange for providing funds to individuals, and imposes a five-year lifetime limit on cash assistance. In FY 2010, 31.8% of TANF families were white, 31.9% were African-American, and 30.0% were Hispanic.
According to the U.S. Census Bureau data released 13 September 2011, the nation’s poverty rate rose to 15.1% (46.2 million) in 2010, up from 14.3% (approximately 43.6 million) in 2009 and to its highest level since 1993. In 2008, 13.2% (39.8 million) Americans lived in relative poverty.
In a 2011 op-ed in Forbes, Peter Ferrara stated that, “The best estimate of the cost of the 185 federal means tested Welfare programs for 2010 for the federal government alone is nearly $700 billion, up a third since 2008, according to the Heritage Foundation. Counting state spending, total Welfare spending for 2010 reached nearly $900 billion, up nearly one-fourth since 2008 (24.3%).” California, with 12% of the U.S. population, has one-third of the nation’s welfare recipients.
In FY 2011, federal spending on means-tested welfare, plus state contributions to federal programs, reached $927 billion per year. Roughly half went to families with children, most of which are headed by a single parent.
The United States has also typically relied on charitable giving through non-profit agencies and fundraising instead of direct monetary assistance from the government itself. According to Giving USA, Americans gave $358.38 billion to charity in 2014. This is rewarded by the United States government through tax credits for individuals and companies that are not typically seen in other countries. Since these per capita charity sums are much higher than in all other countries, this means that private people and companies have a strong say in how social assistance is carried out. This means that public funds in the form of unpaid taxes are distributed according to less professional, less objective, and less unbiased criteria than in all other countries.
Effects
The welfare-to-work intervention program is unlikely to have any impacts on the mental and physical health of lone parents and children. Even when the employment and income rates were higher in this group of people, the poverty rate was high which could lead to persistently high rates of depression whether they were in the program or not.
Income transfers can be either conditional or unconditional. Conditionalities are sometimes criticized as being paternalistic and unnecessary, and research in different contexts shows enforcing conditionalities can result in additional burdens for recipients and social service providers.
A 2008 study by welfare economist and Brown University Professor Allan M. Feldman suggests that welfare can achieve both competitive equilibrium and Pareto efficiency in the market, although different points of Pareto efficiency are more fair to some than others.
Some opponents of welfare argue that it affects work incentives.
Perception
According to a 2012 review study, whether a welfare program generates public support depends on:
- whether the program is universal or targeted towards certain groups
- the size of the social program benefits (larger benefits incentivize greater mobilization to defend a social program)
- the visibility and traceability of the benefits (whether recipients know where the benefits come from)
- the proximity and concentration of the beneficiaries (this affects the ease by which beneficiaries can organize to protect a social program)
- the duration of the benefits (longer benefits incentivize greater mobilization to defend a social program)
- the manner in which a program is administered (whether the program is inclusive and follow principles)
Welfare Issues
Poverty Rate Has Not Lowered
Welfare spending has not lowered the poverty rate of the nation. Most Americans feel that welfare to an individual or family should be temporary. More.

Therefore, the goal should be to get people back on their feet and leave welfare behind. But the poverty rate in the nation has not dropped in over 50 years. Does this mean welfare is a failure? It depends on the purpose of welfare. Is the purpose to lower poverty or is it simply to make lives more comfortable for those in poverty? More.
If you believe the purpose of welfare is to lower the poverty rate in the nation then welfare has failed. The poverty rate was 12.8% in 1968 and has averaged 13.0% from 1969 through 2020. Welfare spending over that time totaled $803 per person in poverty in 1965 versus $22,735 in 2020. That is after being adjusted for inflation. So, welfare spending has increased dramatically, but poverty hasn’t lessened. More.
Personal Development is missing from the system
Education and work ethic are necessary for individuals to make enough money to leave poverty behind. But these traits are generally not addressed in the welfare system. Individuals get resources to help with expenses like food or rent but don’t get mentoring, coaching, or teaching. Welfare doesn’t address life skills. Recipients of welfare are left on their own to improve their lives and leave poverty behind. However, this has not proved successful enough to lower the overall poverty rate of the nation.
The welfare system also does not address the key aspects of helping the poor avoid poverty.
Welfare’s impact is not measured
If the purpose of welfare is to merely make lives more comfortable for the poor, then we need a tool to track that performance. The problem is that we don’t include welfare benefits in the review of the economic health of an individual or family. For instance, we don’t have a vision of how many people are moved out of poverty from our welfare system. More.
Extreme Poverty

The myriad of welfare programs too often miss those in extreme poverty. Extreme poverty is defined as individuals and families at less than half the Poverty Threshold. The poorest Americans are often the least able to navigate the complex welfare system and many simply can’t find their way. Others have alcohol or drug addiction which the welfare system inadequately addresses. That is why there are so many homeless on the street existing outside the safety net that was built to protect them.
Benefits to those in extreme poverty are too low and those in the middle class are too high.
Cash Versus In-kind Benefits

Cash is more valuable to the poor than are in-kind benefits such as a voucher for housing, food or pre-school. Today a low-income single mom could qualify her family for SNAP, TANF, Housing Assistance, Lifeline, LIHEAP and, depending on the age of her children, WIC, School lunch, Child Care and Head Start. These programs attach their benefits to vouchers or rules and the mom is forced to adapt. For instance she can’t make her own pre-school plans or pack her own sack lunch, Often times welfare recipients take the benefits because they are free but if they were offered the same benefit in cash, or even a lesser amount in cash, they would much prefer to have that. The poor are scrappy and hardy and many times can stretch a dollar a long way. But they can’t use that skill with the bulk of the welfare system.
Complexity

The welfare system was never created as a single system like Medicare or Social Security but instead as independent programs addressing a certain need. The result is a very bureaucratic system that is hard to use. The welfare system is made up of 13 large programs, many with multiple facets or stand-alone programs beneath them (see Welfare Programs). For instance housing assistance can take the form of public housing, rent vouchers, or tenant support and each of these have various facets or unique programs beneath them.
The 13 programs are generally run independently from one another and are managed by 8 large agencies in Washington that generally don’t interface with one another. Most of the 13 programs have unique qualification standards (See Safety Net Page). They have separate forms, rules, compliance, audits, etc. Some work in conjunction with state or local programs and some are run completely independently.
Cash Versus In-kind Benefits
Cash is more valuable to the poor than are in-kind benefits such as a voucher for housing, food or pre-school. Today a low-income single mom could qualify her family for SNAP, TANF, Housing Assistance, Lifeline, LIHEAP and, depending on the age of her children, WIC, School lunch, Child Care and Head Start. These programs attach their benefits to vouchers or rules and the mom is forced to adapt. For instance she can’t make her own pre-school plans or pack her own sack lunch, Often times welfare recipients take the benefits because they are free but if they were offered the same benefit in cash, or even a lesser amount in cash, they would much prefer to have that. The poor are scrappy and hardy and many times can stretch a dollar a long way. But they can’t use that skill with the bulk of the welfare system.
Make Work Pay

Today’s welfare system of independent programs discourages work because at certain income levels benefit loss is greater than additional income earned. Many of the individual welfare programs, like SNAP, are correctly indexed to a participant’s income whereby work and additional wages are encouraged. For example, benefits are lowered $.50 for each $1.00 in additional income a participant earns. However, when benefits are examined in whole across the entire welfare system, this is not the case, because the overall welfare system is not coordinated. Those who work in poverty and welfare call this “cliffs.” See more information on Work for Welfare Page.
Marriage Penalty

Today’s welfare system often discourages marriage because a disproportionate loss in benefits occurs when two people marry. For example a single mom with a minimum wage job could lose all of her benefits is she marries a man earning $20,000 a year. Often the decision is made by the mom to just live with the man and keep the benefits. See more information on the Welfare Examples Page.
Conditions
There are very few Conditions attached to today’s welfare system. Conditions could include, work requirements, job training, school attendance and/or grades obtained, drug and alcohol testing or simply limited time frames. The TANF Program has a work requirement and limited timeframes, but most of the rest of the 13 programs in the Welfare System have no conditions. Many argue that without conditions the Welfare System does not encourage recipients to change their lives in any manner. Others argue that such conditions are unfair when the economy is tough and jobs are not available. For Conditions to be impactful they would need to be established on the welfare system as a whole as opposed to isolated individual programs.
Move Welfare to the States
Many people believe the federal government should make block grants to the States and allow the States to develop and manage welfare programs. They argue States are:
1) Closer to the people they serve.
2) Are better laboratories for programs and policies
3) Already spend a large sum of their own money on welfare
4) Know their needs better than “one-size fits all” federal mandates.
The improvement and cost savings ideas presented in this website would work at the state or federal level.
Block grants to the States could be calculated based on the total number of people in poverty within the state or based on total state population. Basing the grant on total population would better motivate the states to move people out of poverty instead of being paid more money as poverty rolls increase.
Move Welfare to Non-profit Organizations
Many people believe that government at the state, federal or local level should not be involved with welfare and that non-profit organizations and the people should take over this responsibility. They argue that non-profit organizations are far more efficient in their spending programs and can work more effectively one on one with people. They can be flexible and nimble and are not forced to adapt formulas applied across the board. Many argue it is a conflict of interest for the government to be distributing benefits to voters and pits Americans and localities against one another. They argue that the government taking over the responsibility for taking care of our fellow Americans has lessened the moral obligation of people taking care of one another.
Cost Savings

Ideas for lowering spending are presented on the cost saving page. Our current system is so poorly focused we can get more cash to the poorest Americans and still spend far less.
Welfare Ethics
It is time the citizens of the U.S. took a hard look at welfare ethics. Design flaws and unintended consequences have created the following moral issues we simply must fix:
- We ignore the plight of the mentally ill.
- We put the middle class ahead of those in extreme poverty.
- We put government ahead of helping the poor.
- We discourage work and marriage.
- We enable alcoholism and drug addiction.
- We take away pride
Welfare Reform
This is what we should do to reform the current federal welfare system. Roll-up the 13 welfare programs into a single program that pays cash to the poor and lifts nearly all Americans out of poverty. Start with $8,000 annually per adult and $5,000 per child and reduce those amount as individuals earn income from wages and self-employment. This would cost us $263 billion a year and raise most Americans out of poverty. We currently spend $363 billion on 13 welfare programs so take the savings, $100 billion, and pay down the deficit. That is a meaningful contribution toward deficit reduction. The poor get more cash and flexibility, the program is simple and much easier to manage and we help the deficit in the process. At the same time we should change the philosophy of welfare to add a quid pro quo before benefits are paid – we need to establish “something for something”. No more pure handouts; low-income Americans of sound mind and body have much to offer and the nation has many needs.
Both Milton Friedman and Martin Luther King would agree that a guaranteed income is the best way to attack poverty in the United States.
Our current system of 13 independent programs has many problems associated with it such as inconsistent treatment of low-income Americans, not enough benefits to those in extreme poverty and work and marriage penalties. A new, simplified welfare system paying cash to the poor would solve these problems. The poor would much prefer the cash than the myriad of in-kind benefits they receive today and could stretch the dollars much further to improve their standard of living. This would give the poor far more dignity and control over their lives. It would also make welfare much cheaper for the tax payer. In-kind benefits are expensive.
A new federal welfare program that paid a base level of income to the poor would allow state and local governments to refocus their programs. States and localities spend an additional $220 billion every year on welfare, not including Medicaid.
“Something for something” should be the quid pro quo of welfare benefits when we are working with those of sound mind and body that can help themselves. It doesn’t need to be fully reciprocal – the value of the benefits given doesn’t have to equal the value of something received. The something given should be cash, the something received can be the further education or training of the person receiving aid. The something received can be working within the community. Our communities have many needs such as working with youth, reading to toddlers, supporting local charities, cleaning up parks, working with the elderly, etc. For those working full time this fact must be respected but there are still things they can do to support the community, does not put a job at risk and helps achieve a cultural encounter. The idea of something for something is to help us establish community together while the individual grows in life skills. The poor have much to offer our communities and our communities have many needs.
This is not a call for government employment of those on welfare, but instead turning our programs into a “hand up” instead of just a “hand out” as exits today. This philosophical change would help foster pride, help the poor to acquire new skills and independence and tell the poor they have an important contribution to make to the productivity of the nation. Because …. they do!
A cash benefit program could be structured like this:
For all adults in poverty guarantee a minimum income of $8,000 per year. As the person makes money from a job or self-employment, lower the $8,000 benefit by $.50 for every dollar made by the individual. For example if the individual has a part time job and makes $5,000 a year they would still get a guaranteed income payment of $5,500 per year. This means the individuals overall income level for the year would be $10,500.
For every parent in poverty establish a guaranteed income of an additional $5,000 per child which drops ten cents for every dollar earned by the parent.
Such a program would have cost the federal government $263 billion in 2018 based on Census Bureau population and income statistics. In 2019 we spent $363 billion on thirteen bureaucratic and complex welfare programs, much of it to the middle class. If we reformed welfare by replacing the complex programs with a simple cash payment to welfare recipients we could move virtually all Americans out of poverty and save $100 billion at the federal level.
Some Facts About Welfare
What are the negative effects of welfare?
Because welfare reduces work effort and promotes illegitimacy and poverty-prone single-parent families, it actually may cause an overall decrease in family incomes. Welfare is extremely efficient at replacing self-sufficiency with dependence but relatively ineffective in raising incomes and eliminating poverty.
What are the positives negatives to welfare programs?
Those in favor of welfare point to the many benefits the programs provide for the poor and their families.
- High Need Among Americans. Advocates point to the many benefits of welfare programs. …
- Helps Children. Source. …
- Reduce Crime. …
- Social Good. …
- Too Much Taxation. …
- Creation of Dependency. …
- Too Expensive to Maintain. …
- Fraud.
Why social welfare schemes of government are not so effective as they should be?
Mismanagement, corruption and lack of political will are often considered as the reasons behind the failure. Recently, tribal communities in Biligiriranga Hills were caught selling ghee supplied under a social welfare scheme.
Does welfare cause poverty?
Welfare does not reduce poverty; it may actually increase it. The Census Bureau determines the poverty status of a family by comparing the family’s pre-tax cash income with a poverty threshold that depends on family size and composition.
Who benefits from social welfare programs?
The most common types of programs provide benefits to the elderly or retired, the sick or invalid, dependent survivors, mothers, the unemployed, the work-injured, and families. Methods of financing and administration and the scope of coverage and benefits vary widely among countries.
What are the advantages and disadvantages of generous social welfare programs?
Top 10 Welfare Pros & Cons – Summary List
| Welfare Pros | Welfare Cons |
|---|---|
| May help to prevent old-age poverty | Symptoms are cured, not the causes of poverty |
| Welfare can increase overall life expectancy | Requires some level of administrative work |
| Humans should feel obliged to help people | Lower motivation to work |
Is the welfare system helpful to society?
In times of normalcy, social welfare is vital to society
Social insurance, such as unemployment benefits, create a risk-sharing economy in which the threat of potential economic difficulties befalling any one person is protected by the majority.
SOCIAL WELFARE: DO ITS ADVANTAGES OUTWEIGH ITS DISADVANTAGES?
America’s first social welfare program began with FDR, in response to the poverty begot by the Great Depression. While nobly intended, his Work Progress Administration was met with derision by many of his political opponents, and the debate over government handouts has continued ever since. Well before the coronavirus pandemic hit, President Trump previously signed an order in 2018 calling on states to impose stricter criteria on welfare recipients. However, the recent health crisis has spurred his administration to sign a $3 trillion aid package, of which $300 billion will go toward one-time cash payments to individuals and $260 billion will go toward extra unemployment payments. In times of crisis, social welfare is undoubtedly necessary, but in times of normalcy, is it necessary or harmful to the people it’s intended to help?
Here are three reasons that, in times of normalcy, social welfare impedes productivity, and three reasons that it is necessary.
In times of normalcy, social welfare discourages productivity
The system is set up to be abused
Social welfare packages provide people with little incentive to work. For example, “Welfare Queen” Linda Taylor cheated the system in the ‘70’s and acquired over $150,000 a year from the government – a much higher “salary” than many make in their lifetime. There are less grand examples of others who may not want to permanently live off state handouts, but, like single mother Iris Swift admits, there are “a lot of advantages to staying on welfare.” According to a Cato study, US welfare packages exceed the minimum wage in benefits and salary in every state. If that’s the case, why wouldn’t people take advantage of the system when they get paid more not to work?
Short-sighted goals
While welfare may be helpful in getting individuals out of tight financial spots, it may do little to support future self-sustainment. The government does a poor job of weaning the needy off of welfare and teaching them how to enhance their employability or earning potential. Not to mention that high marginal tax rates come into play when a household’s income increases. The minute a family attempts to cross back over the poverty line, these tax rates are combined with benefit phase-outs, resulting in a loss of 50-60% of the family’s initial income gain. This provides incentive to avoid jobs that pay highly enough for self-sustainment, promotions, and increased hours of work, subsequently trapping people in the cycle of poverty
Psychologically unhealthy
Welfare benefits create a harmful culture of psychological dependence. A study found that welfare recipients are deprived of positive feelings of self-worth after receiving handouts – feelings that are necessary to function in society at full capacity; lack of self-esteem contributes to a lack of motivation and a diminished desire to move up in life. Research from a Yale University study corroborates these findings. Even former President Obama – a staunch advocate for social benefits – cited his own anecdotal evidence of welfare programs encouraging this culture of dependency and reducing motivation in their recipients.
In times of normalcy, social welfare is vital to society
Improves the economy
Social insurance, such as unemployment benefits, create a risk-sharing economy in which the threat of potential economic difficulties befalling any one person is protected by the majority. Take the Great Recession as an example, where unemployment rose by record levels, yet the poverty rate only increased by 0.5%. These social benefits also contribute to a more economically efficient society; for example, research found that increasing food stamps programs and public insurance in several states led to more entrepreneurship, because they made it less risky for would-be business owners to venture out on their own. Unemployment benefits also provide people leeway to find jobs that match their skill sets, rather than snapping up the first available position. In other words, overall economic productivity increases as a result of government assistance.
Not what it looks like
Contrary to the argument that welfare disincentivizes people from working, welfare beneficiaries are often those who cannot work. A third of the people who received government assistance in 2015 were off it within the year. In 2018, the number of people registered for food stamps dropped 7 percent year over year, following a 4.5 percent drop in 2017, showing a continued downward trend. Plus, most adults who qualify for TANF (Temporary Assistance for Needy Families) for an extended period of time have physical and mental disabilities. Additionally, a large percentage of children in the US receive of one of the six major forms of government assistance, and they participate in these programs longer than do adults. Welfare benefits aren’t for the lazy – they’re for the needy.
Gives low-income children a chance
Aside from adults, social welfare can also brighten the future for poverty-stricken kids, ultimately halting the cycle of poverty in families at risk. A recent study from Georgetown University and University of Chicago found that Mexico’s Prospera – a cash-transfer system conditional on parents sending their children to school and staying up-to-date with doctors’ appointments – led to greater increases in children’s educational attainment long-term. These children grew up to work an average of nine more hours a week than their counterparts who weren’t enrolled in the program, in addition to earning higher hourly wages. Another study found that kids who were covered by Medicaid later earned more money and required less welfare assistance as adults. Poverty can be traumatic for children, and welfare helps the next generation become less reliant on government support.
The Bottom Line: In normal times, when the economy is not paralyzed by Covid-19, social welfare can easily be taken advantage of and may not leave its recipients with much motivation to provide for themselves. However, government assistance provides a hopeful future for individuals in need and the economy as a whole. Thinking back to pre-coronavirus times, do you think social welfare has benefited your community?
There is a complaint that the welfare stipends are not enough to pay the bills. Well that is nonsense, it was never meant to replace a persons paycheck. If people can make a living sitting home and watching TV, of course they will do it. Which is exactly what happened during the COVID-19 pandemic. Businesses could not compete with the government. If you don’t think there is a labor shortage try going to a restaurant. The restaurant is only half full and you still have to wait to be seated, there just is isn’t enough help to staff them to there capacity. Right now there are more jobs than available people to work them. This is not that there aren’t enough people, there simply aren’t enough people who want to work.
Welfare was created to help the disadvantaged, handicapped, widowed individuals with family and no source of income, it was not meant to replace healthy young adult’s income source. Hey I have an idea, don’t start a family until you have a job sufficient to support them, starting and raising a family is a responsibility not to be taken lightly.
The Shortcomings of a Work-Biased Welfare System
The recently passed American Rescue Plan Act has once again brought attention to the U.S. welfare system. This EB provides an overview of the welfare system — including recent changes — and assesses the system’s effectiveness in achieving its goals. The brief highlights a “work bias” that is embedded in many U.S. welfare programs and has both intended and unintended effects on the system’s ability to combat poverty.
All advanced economies have implemented safety net programs with the goal of ensuring that basic standards of living are met for everyone. These safety net programs — collectively known as welfare systems — strive to put floors on how low individuals’ consumption and well-being can go.
While opinions differ regarding the size and nature of welfare systems, most agree that any redistribution should be accomplished as efficiently and equitably as possible. Naturally, then, changes to how transfers are determined and carried out attract the public’s attention.
The U.S. welfare system includes a broad variety of means-tested programs aimed at reducing poverty by providing government-sponsored benefits to eligible individuals and families. While these programs have helped shrink poverty dramatically in the U.S., it has not been eliminated. Currently, one out of every six Americans is poor according to the U.S. government’s official definition of poverty, meaning they earn less than $12,880 per year.
Poverty has negative consequences that are both long lasting and far reaching. There is good evidence of long-lasting harm to people — especially children — when they undergo even short, temporary stints in poverty.
In addition, poverty affects a larger number of people than the poor themselves, because it is often associated with drug abuse, mental health issues, involvement in the criminal justice system, increased incidence of divorce, and teen and out-of-wedlock pregnancy. Negative effects on societal well-being that surpass the damage done directly to the affected individuals are called “negative externalities” by economists. Because these externalities are generally significant, they provide additional incentives for societies to provide welfare assistance — incentives that supplement more altruistic motives such as empathy and moral obligation.
The U.S. Welfare System’s Work Bias
The U.S. is rather unique among industrialized nations in the modest magnitude of its welfare system. For instance, the U.S. is the only advanced economy that does not have universal health care.
In a uniquely American way, the debate over welfare is a debate not just about fighting poverty, but also about worthiness, fairness and work ethics. Though the system has a purported goal of alleviating poverty, the goal is often framed within the context of encouraging work and disincentivizing dependence on the system itself. Thus, the focus shifts from helping the poor to helping the working poor. The U.S. welfare system’s “work bias” is embodied in stringent work requirements for welfare recipients and a distinct dearth of support for able-bodied, non-elderly, jobless individuals.
The U.S. has a deep-seated tension between the concept of a safety net and the concept of self-reliance. America is considered by many to be “the land of opportunity,” and the welfare system’s work bias reflects the assumption that such opportunities are there for those who work hard enough.
However, the very existence of a welfare system implicitly recognizes that some may need extra help from the government, as they may not be able to gain access to such opportunities otherwise, regardless of effort. The recent economic recession — induced by the COVID-19 pandemic — has put into stark relief the consequences of connecting support to the poor to their ability to work and has challenged the previously wide consensus on a welfare system that supplements the poor’s consumption conditional on them working or looking for work. This represents, perhaps, one of the most momentous shifts in the public perception of the welfare system since the mid-1990s reforms.
The Main Parts of the U.S. Welfare System
The current U.S. welfare system is rather complex. There are two main types of programs: tax credits, and benefits for poor households in the form of cash assistance or in-kind transfers.
The main benefits programs are:
- Temporary Assistance for Needy Families (TANF)
- The Supplemental Nutrition Assistance Program (SNAP), more commonly known as food stamps
- Subsidized housing programs, which defray housing costs
- Medicaid and CHIP, which provide health care assistance to poor adults and children
The health care programs are by far the largest and fastest growing, accounting for well over a quarter of the federal government’s budget and 5 percent of GDP. (See figure 1 below.)

Benefits programs are mostly in-kind in nature: They provide food, housing or medical services. The only program not entirely in-kind is TANF. About one-third of TANF’s budget is spent on cash transfers, while the other two-thirds fund a diverse array of services to boost job readiness for recipients.
Most of the benefits programs have stringent work requirements and are targeted to parents, so they are typically greatly reduced or not available to poor individuals who do not work or do not have children. For example, a single mother with two children between 5 and 18 years old needs to work at least 30 hours a week to be eligible for TANF. This requirement drops to 20 hours a week if one of the children is under 5 years old. Similar work requirements are in place for housing assistance, while SNAP and Medicaid are nearly universal.
Tax credits are another large part of the welfare system. The earned income tax credit, or EITC, is an annual refund on a family’s tax obligations. It is only available to those with some work earnings and is much more generous to parents than non-parents or parents whose children do not live with them. For example, in 2018, the average EITC was $3,191 for a family with children, compared with just $298 for a family without children.
EITC refunds increase with income earned for very poor households before plateauing and eventually tapering off as households continue to increase their income. This structure is both cost-effective and successful in diverting more funds to households who need them most while incentivizing work. (This is because the credit grows as income grows for the poorest households.) This flexible structure has made the EITC — and its sister program the child tax credit, or CTC — very popular.
Economists also favor tax credits because the funds from the program can be used by households to purchase goods and services as they see fit, thus enabling poor households to supplement their consumptions in an unconstrained way, while other programs such as SNAP or TANF provide funds for specific goods and services only.
The EITC and CTC have been historically very successful at lifting parents and their children above the poverty line. This is because they both encourage parents to work more — the more they earn, the more they get back in tax credits (up to a certain threshold) — and directly provide cash to families that they can spend however they like.
Indeed, if we include public transfers and tax credits when calculating the poverty rate, the after-transfer poverty rate went from 25 percent in the 1970s to approximately 15 percent currently. (See the dashed line in figure 2 below.)

Should we then interpret this figure as portraying a successful welfare system? Yes and no. It is true that the welfare system has been successful in supplementing the incomes of the poor and lifting them above the poverty line.
However, one also sees from figure 2 that the poverty rate excluding public support (solid line in figure 2) is remarkably flat over time: It currently stands at about 25 percent, as did in the 1970s. This means the ability of the poor to sustain a higher level of income independently of transfers has not changed over time.
I conclude that the welfare system has not been successful in lifting people out of poverty in a permanent way. Simplifying somewhat, we could say that it is a system that brings people out of poverty, but not up the income distribution. Despite its emphasis on self-reliance, the current structure of welfare programs has done little to foster independence and long-term income growth for poorer households. If it had, we would see the pre-transfer poverty level drop as fewer families would rely on public transfers to avoid poverty. This is unfortunately not the case.
Welfare support is relatively meager. As mentioned earlier, a single mother with two young children needs to work at least 30 hours to qualify for TANF. Even then, though, benefits are typically a small fraction of a state’s median income. For example, a single mother with two children is eligible for a monthly benefit of $170 in Mississippi and a little over $1,000 in New Hampshire. The latter may seem large but is only 1.3 percent of New Hampshire’s median income (and Mississippi’s benefits are only 0.4 percent of that state’s median income).
Although these transfers may avoid abject misery, they are hardly sufficient to purchase high-quality child care, safe and reliable housing and transportation, education and training, or health services — investments in welfare recipients’ human capital that could improve their long-term earnings prospects and lower poorer families’ reliance on welfare transfers to escape poverty.
The Benefits Cliff
There is also another aspect of the welfare system that hinders long-term income growth and sustained well-being for poorer families: benefits cliffs. As individuals improve their income levels, most benefit programs reduce assistance until this amount abruptly becomes zero after a pre-specified income threshold. At that point, an extra dollar earned is exceeded by the loss of benefits, resulting in net disposable income decreasing even as labor income increases.
Understandably, people facing benefits cliffs tend to turn down better-paying jobs to keep their income steady. Benefits cliffs are particularly steep for tax credits, but they are also present in all other programs.
For example, suppose that the single mother in our previous example works and qualifies for assistance (both cash and in-kind) of $1,000 per month. Let’s further suppose she gets promoted to a job that pays an additional $500 per month, and this increase brings her income above the eligibility criterion for assistance. She gains $500 in labor income but loses $1,000 in benefits. So, even though she was promoted to a better-paying job, her income goes down.
Welfare, Recessions and the COVID-19 Pandemic
Another shortcoming of the current safety net structure is that the welfare system is not highly responsive to the economic cycle, making it largely unable to respond to higher poverty rates during recessions. This aspect is a direct expression of the work bias that informs the safety net: Most programs have work requirements, so people who are out of work are not eligible.
But recessions are precisely when people become poor due to losing their jobs. SNAP is a partial exception because it is available to jobless individuals, though assistance to those without dependent children is still limited, thus the reach of the program during economic downturns is far from universal.
The COVID-19 pandemic has brought to light how inadequate the safety net was, especially for the most vulnerable: children. The pandemic has affected a large number of individuals and families, swelling the poverty rate; some estimates put it back at the 1970s level of 25 percent.
The American Rescue Plan Act
This has made poverty more visible to many Americans who were previously unaffected by it. Though this is not the focus of this Economic Brief, we would be remiss not to notice how the COVID-19 pandemic amplified the interactions between poverty and racial inequality and prompted a debate on whether the welfare system can address this interplay, or the root causes of poverty. COVID-19 has also interrupted the upward trajectories of many families who had managed to climb the income ladder and reach the middle class. The American Rescue Plan Act that Congress recently passed attempts to address these unique circumstances.
The bill has two main components. First, it makes direct payments to individuals to cope with the effects of the pandemic and related severe economic downturn. Direct payments are almost universal. Thus, they are not addressed to combat persistent poverty but rather to relieve the temporary economic distress brought about by the pandemic.
Second, the bill reforms the safety net paradigm to better support working families with children. These provisions are more directly related to our discussion of the welfare system. These reforms include significantly expanding the size and scope of the EITC, CTC and the child and dependent care tax credit. These new benefits do not taper off with the number of children in households — unlike most other welfare programs — and have significantly higher income thresholds to alleviate the impact of benefits cliffs on low and middle earners.
These provisions plausibly signal a profound change in how voters — and the legislators they elect — envision the welfare system and its role in supporting families and children of lesser means. They recognize that we all have a vested interest in healthy, thriving children. Investing in children has high returns not just for individuals but also for society as a whole and, thus, is a worthy cause to spend public money on.
Though some of these provisions are slated to expire after one year and some after five years, I believe that the benefits from making them permanent would be substantial. My hope is that there is clear political will to consider such changes in a permanent way. Overall, both public opinion and policymakers have come to view a European-style safety net on American soil more favorably than ever before. I regard this as a momentous shift of the public opinion and a precious opportunity to reflect on what policies, programs and public interventions may lead more of us to share more broadly in the wealth our economy creates.
The Undeserving Poor
The American welfare state has grown, but so have the ranks of the poor. As the U.S. tries to focus help on those deemed most worthy, millions of adults are getting squeezed.
The U.S. federal government spends hundreds of billions of dollars a year on aid to the poor. There isn’t enough to go around for Shaun Case.
The 34-year-old Indiana native has learning disabilities and endured a childhood of abuse. Relatives say he was thrown through a plate-glass window by his grandmother when he was a teen, leaving him with a permanently numb left hand. Social workers consider him well enough to work, though, and he never qualified for disability benefits.
So, in the past decade Case has scraped by in temporary jobs, never making more than $10 an hour. Now, he’s out of work again. He gets no unemployment benefits; he wasn’t in his last gig long enough. He can’t get Medicaid because he has no dependent children at home. Until October, his only help was $200 a month in food stamps. Because of a paperwork error, the government cut him off. With or without food stamps, he has to scrounge for cash, selling plasma at a blood center twice a week for $30 a pop.
“What’s out there for people like me?” said Case. “There’s nothing.”

The reasons are complex, but it boils down to this: American society has decided that people like Shaun Case, the able-bodied poor, don’t deserve much help. As a result, and despite record spending, a growing number are falling through the gaps in America’s patchwork of welfare programs.
Case is one of 12.2 million adults of working age, with no children at home, who were living below the poverty level in 2011. That’s up nearly double from two decades ago. And of those, 5.6 million received no assistance from any of the major five federal programs, a Reuters analysis of Current Population Survey data found. That’s the highest number since 1992, the first year for which comparable records are available. Then, there were 4.3 million unaided poor adults.
Another 1.4 million able-bodied adults received only food stamps, up from 732,000 in 1992. That program keeps people from going hungry, but doesn’t help pay for other necessities such as rent, heat or dental care.
The population of unassisted poor adults is growing at a time when the United States is grinding through a prolonged stretch of rising poverty and income inequality.
More poverty, more spending
The number of Americans below the federal poverty level – $22,350 a year for a family of four – hit 48 million in 2011, 17 million more than in 1989. Indiana has seen the second-largest increase in poverty of any state in that time, according to a Reuters analysis of Census data. Sixteen percent of the Hoosier State was poor in 2011, up from 11 percent.
The prime reason for the latest surge in the number of poor people has been the weak economy, not a stingy government. Antipoverty spending has actually increased overall.
Nationally, the federal government put a record $506 billion last year into its five major means-tested programs for low-income, able-bodied Americans. Outlays on these programs – food stamps, Medicaid, cash welfare, housing assistance and tax credits – were up more than triple since 1989, adjusted for inflation. The 50 states spend tens of billions more.

If it weren’t for such assistance, the poverty rate would be much worse. Some economists say the rate is somewhat overstated, too, because it doesn’t count non-cash aid such as food vouchers.
Today, the elderly, the disabled and the working poor get most means-tested assistance. Higher Medicaid spending – driven by expanding rolls but also by soaring healthcare costs – eats up a growing piece of the overall budget. Part of this shift toward the elderly and disabled is no doubt due to the aging baby boomer population.
Still, people who don’t fall into favored categories are getting pinched, especially jobless adults such as Case.
Brandi Burnau faced a perverse welfare incentive as she weighed whether to raise her baby daughter in poverty or put her up for adoption. Jobless construction worker Jeremy Toler, befuddled by the system, passed up benefits his large family may be eligible for. Alexsandria Elliott, a former hotel housekeeper, fell so completely through the cracks that she was unable to get treatment for a debilitating dental disease.
Indiana’s innovations
Their home state of Indiana has put in place some particularly stringent limits on poor individuals and families as part of a decades-long effort to revamp welfare.
In 1994, then-Governor Evan Bayh, a conservative Democrat, created work requirements for Hoosiers who received welfare benefits. And if a woman on welfare got pregnant, she’d receive no extra assistance for the newborn.
“The bottom line was trying to make someone self-sufficient,” Bayh said in an interview. “We were trying to achieve two values – one was the notion of community, and also responsibility.”
Two years later, President Bill Clinton and House Speaker Newt Gingrich replaced a federal cash program for poor families dating from the 1930s with a new program, Temporary Assistance for Needy Families, that required adult recipients to seek work. Clinton, a Democrat, called the overhaul “ending welfare as we know it.”
Republican Mitch Daniels, Indiana’s current governor, took it a step beyond. He outsourced management of the TANF system and the intake of Medicaid and food-stamp applicants to IBM. He set a strict lifetime limit of 24 months for cash welfare compared with a federal guideline of five years. Enforcement of work requirements was toughened. Recipients who fail to find work in six weeks must perform community service, such as street sweeping.

Indiana’s poverty rate – 16 percent – has seen the second-biggest rise in recent years, after Nevada. REUTERS/Aaron P. Bernstein
That provision was designed to shoo people off the rolls, said Mitch Roob, who implemented the changes as head of Indiana’s social-services agency.
“It was so unpleasant,” Roob said in an interview, “that people would think, ‘I’m just going to get a job instead.’”
Daniels tightened in other areas, too. Parents now have to prove they are seeking child support before getting welfare. If the other parent fails to pay $2,000 in child support for more than three months, his or her drivers license is suspended.
Cash aid dries up
Since Indiana began revamping its system, the share of poor Indianans getting cash welfare has plummeted, even as the number of households in poverty grew by more than half.
In 1999, an average of 38,000 families per month received basic cash assistance from the TANF program, according to Indiana’s Family and Social Services Administration. By 2011, just 22,400 did – a 41 percent decrease. The average monthly amount each family gets also dropped, from $253 to $205.
Overall federal and state spending on TANF in Indiana has actually increased 10 percent since 1998, according to figures from the U.S. Department of Health and Human Services. But only a fraction now goes to cash assistance – $72 million out of $292 million. That is down 50 percent from 1998. The rest goes toward intangible programs like job training or education about marriage and pregnancy-prevention.
It’s a national trend: America has slashed the number of people on cash welfare by two-thirds since 1996, to 1.4 percent of the populace.
Housing aid also hasn’t kept up with the growth in poverty. From 1999 to 2011, the number of Hoosier households in poverty grew by more than half. But in 2011, the number receiving either public housing or federal rent subsidies was just 5 percent higher than a decade earlier. Today, just 16 percent of poor households get federal housing help.
The number of American adults on the most expensive program for the poor, Medicaid, has tripled since 1990. The average amount spent per working-age adult has fallen 12 percent, even as medical costs have soared. States have a say over who is eligible. In Indiana, working parents have to earn less than 24 percent of the federal poverty level to qualify – currently, no more than $5,532 a year for a family of four. That’s the strictest level in the country, along with Alabama. Indiana is one of 41 states that don’t cover childless adults.
Conflicted feelings
The food-stamp program also has expanded dramatically, both nationally and in Indiana. In 1999, only half of poor Indiana households got food stamps. By 2011, just under 90 percent of a much-bigger number of impoverished households were covered. Each on average received $300 a month, an amount unchanged since 1999 when adjusted for inflation.

Food-stamp spending has exploded, but many need extra help from food pantries such as this one in Indianapolis. REUTERS/Aaron P. Bernstein
Another growing program is the Earned Income Tax Credit, which increased nearly sixfold amid the welfare-to-work overhauls. But it’s a payment that comes just once a year. And it’s meant to top up the incomes of people with jobs, who make up to twice the poverty level. People without earned income don’t qualify.
As lean as the times are, Americans are conflicted about expanding poverty assistance – even poor Americans.
On a recent Thursday afternoon, Tanya Jones was among a hundred men, women and children waiting for free groceries at a cavernous former printing plant in Indianapolis that’s now one of the largest food pantries in the Midwest. Asked what she would change about public assistance, she said the government should stop benefits from going to those who don’t deserve them.
“You got all these people who can work, who won’t,” said Jones, a 28-year-old mother of two, whose $12.75-an-hour job as a caterer isn’t enough to feed herself, her two children and her mother. “I feel the help should be there for the people who need it, not the people who don’t want to work.”
Poll findings
That ambivalence about helping the poor is widespread. A Reuters/Ipsos poll of Americans in October and November found that 52 percent of respondents said the government isn’t doing enough to help the poor. Yet 40 percent said that most people who receive aid don’t deserve it, a follow-up survey found.
Respondents overwhelmingly opposed aiding non-disabled adults. Sixty-six percent of respondents felt the elderly deserve cash assistance, and 40 percent said children do. Just 14 percent supported cash help for able-bodied poor adults without dependent kids. (Because these polls are collected online, accuracy is measured using a credibility interval. For these questions, the interval was 1 percent to 1.5 percent.)

Those values are reflected in poverty policy. In a 2011 paper, economists Yonatan Ben-Shalom, Robert Moffitt and John Karl Scholz found that families in which no one is continuously working and which have no elderly or disabled members are the “most underserved” by U.S. antipoverty programs of any group.
Their poverty rate, the authors calculated, was 67 percent after factoring in government aid. For the elderly, it was 9 percent.
That’s because the elderly enjoy the two largest federal entitlement programs, Social Security pensions and Medicare health insurance. These are aimed at all seniors, not just poor ones. The two spent a combined $1.2 trillion last year – more than the entire federal budget aimed specifically at the poor.
‘Sturdy beggars’
Suspicion of the able-bodied poor runs deep. Policy makers for centuries have gone through phases in which they view welfare through the concept of the “deserving and undeserving poor.” Sheila Suess Kennedy, a professor of law and public policy at Indiana University, said the concept harkens back to 15th-century England, where statutes banned charity for people who appeared able to work. They were called “sturdy beggars.”
The United States is in such a phase now. When President Lyndon Johnson launched the “War on Poverty” in 1964, the prevailing view was that the poor were victims of circumstances beyond their control. That changed in the 1980s and 1990s. Conservative critiques of the welfare state as a source of debilitating dependency, as well as widespread claims of fraud, eroded support for cash assistance and paved the way for the 1996 overhaul.
Some economists say the effort to incentivize worthiness has created an incoherent system of relief for the poor. Some households get the panoply of means-tested benefits – food stamps, Medicaid, TANF, housing subsidies and tax credits. Others get little or nothing.
“We have a kind of patchwork set of programs,” said Robert Moffitt, professor of economics at Johns Hopkins University in Maryland, “where some families fall through the cracks, and some other families get more than maybe they would under a better-designed system.”
Gov. Daniels agrees the system isn’t working. He say it’s “well-intentioned” – but has become convoluted with programs “stacked on top of each other for two generations now.” Smarter spending, not more spending, is the answer. “The money it wastes is the second-biggest problem,” he said in an interview. The first is “the undermining if not destruction of human dignity and the ethic of personal responsibility.”

A difficult decision
Brandi Burnau, a round-faced 22-year-old with brown eyes, said she has been struggling on her own since she aged out of the foster-care system four years ago. Single and unemployed, Burnau recently had a baby daughter, Ava. Eight months ago she made a hard decision: She gave Ava up for adoption.
At the time, she was working in a warehouse outside Indianapolis stocking shelves, and she burst into tears every time she saw baby books. She left work early a couple of times, she said, and was let go. Having been on the job just three months, she was ineligible for unemployment benefits.
Burnau took to sleeping in her car, in homeless shelters and at the homes of strangers she met at the bus stop. Last month, Burnau was asleep in the car, which bore a sign that read “homeless and desperate.” An older woman knocked on the window and gave her food, and invited Burnau to stay at her house for as long as she needs. “We now go to church together,” she said. “She’s helped me a lot.”

Brandi Burnau with a nephew. She gave up her baby for adoption, reducing her eligibility for welfare help. REUTERS/Aaron P. Bernstein
But her future is uncertain, and Burnau is mystified by the incentives the welfare system presented her. A simple financial calculus, she said, would favor keeping Ava. She received $3,000 for living and medical expenses from the adoptive family during pregnancy, the cap under state law.
As a single parent, Burnau said, she could have soon received much more than that in additional welfare benefits: TANF cash aid for mothers, more money in food stamps, free Medicaid coverage and preferential treatment at homeless shelters. Today, she said, she gets $180 a month in food stamps, but no other government aid.
“When you’re single, they don’t care,” she said. “If I had kept my baby, I would have benefited, but I didn’t want to be selfish.”
Jeremy Toler, 36, is also puzzled by the welfare state, and he used to work for it.
Navigating the system
After serving in the army reserves and graduating from Ball State University with an associate’s degree, Toler got a state job processing claims in a child-care program for the poor. When the state automated the system, he and the rest of his office were laid off.
Toler then landed a series of construction jobs, working for the past three years at a local demolition and building company. After two marriages that ended in divorce, he now lives with his girlfriend and the five children they’re raising – four from their previous marriages, and one they had together.

In June, he moved to another construction firm, but unhappy there, Toler quit. That was a mistake. Under the federal unemployment insurance system, workers get benefits only if they are laid off, not if they quit. A few weeks later, his girlfriend lost her job.
Since June, Toler said recently, he has applied for dozens of positions without luck. The family lives in a trailer home and gets by on Medicaid, food stamps and donations from local food pantries. Like Case, he also sells plasma twice a week.
Toler has had trouble navigating the Temporary Assistance for Needy Families program. He believed he and his girlfriend each had to spend a total of 70 to 80 hours a week in resume workshops or actively looking for jobs. He also thought the state provided no childcare. After being told their family would receive $300 per month from TANF, he said, they decided it wasn’t worth applying.
State officials said the program, in fact, provides childcare and requires a combined 55 hours a week for a couple. They said a family of seven – like Toler’s – can receive up to $522 per month.
‘A little help’
His troubles are mounting. This summer, Toler’s truck was repossessed. He stopped paying the child support he owes an ex-wife on the child she is raising, and was briefly arrested in October and ordered to appear in court after she reported him. He has also stopped making payments on the $17,000 mortgage on his trailer home and his $1,900 in student loans.
“It seems like the harder you worked in life, the less help you get,” Toler said.

Indiana adults such as Shaun Case face strict limits on welfare. He sells plasma at this center, at $30 a pop. REUTERS/Aaron P. Bernstein
Some fall completely through the gaps. Seven years ago, Alexsandria Elliott, now 37, said she developed hereditary periodontal disease. Last year, the infections grew so severe that a doctor told her she may die if she didn’t have her remaining eight teeth pulled. The extractions would cost $2,300. First she had to find the money.
Elliott, who used to work as a low-wage hotel housekeeper, didn’t have health insurance. She couldn’t get on Medicaid, because working-age Indianans without dependent children aren’t eligible. She didn’t qualify for cash welfare benefits for the same reason – her daughter was over 18.
In February, she had to borrow to have the dental surgery, leaving her with a debt to pay. When she gets a job, she hopes to raise the $800 she said she’ll need to buy dentures. Elliott also isn’t receiving food stamps.
“I tried the (university hospital), I tried the schools, I tried state assistance…. And nothing,” said Elliott. “And I’m suffering to the degree I want to shoot my head right off my shoulders and can’t take it anymore. Why can’t I get a little help to pull a tooth?”
Shaun Case’s problems began long before his difficulties in getting help from the government.
Tough start
Case, a short and mild man with a boyish face, favors baggy clothes. The son of a drug-addicted mother and alcoholic father, he – and his three brothers – spent much of childhood in foster care. Case’s mother said she was abused by his father, and she fled when Shaun was a toddler. Shaun’s father repeatedly beat him and his brothers, according to Case, his mother and a sibling. When Case was 14, his grandmother pushed him through a window. He nearly bled to death from the resulting gash in his wrist, relatives say.
“Two major arteries were cut,” said Case, who also suffered nerve damage. “I have no feeling in my left hand.”
Placed in foster care, Case underwent a psychiatric evaluation. He was found to have a learning disability but not bad enough to have him officially declared mentally disabled.
Case’s father couldn’t be reached for comment.
When he was a senior in high school, Case got his girlfriend pregnant and dropped out to try providing for her. She later miscarried but the two eventually married. The couple had two daughters together, but divorced.
His primary source of employment has been temp agencies. He has worked as a janitor, airport security guard, construction worker and in other low-paying roles. He has no substance-abuse problems and no scrapes with the law, relatives say.
But Case’s meager skills and cognitive problems trap him. He has tried to get a high-school equivalency degree but struggles in the classroom. His temporary work assignments have all ended with companies choosing to not permanently hire him.
The biggest challenge
“It didn’t work out,” Case said, referring to a stint as a supermarket cashier. “I was either giving too much or too less change. The manager was like, ‘Are you serious? What is going on here?’”
Emotional problems hinder him as well. “People will tell him he’s retarded or stupid and it sets him off,” Case’s older brother Joe said in an interview.
Today, Case and his siblings remain mired in poverty. Joe makes $400 to $500 a month as a self-employed computer consultant, and Joe’s wife makes $1,000 a month at a daycare center, with no health benefits. Raising five children together, Joe said, they usually receive Medicaid and $520 a month in food stamps.
As an able-bodied adult without dependent children, Shaun qualified for no help other than food stamps. He has repeatedly applied for disability but been turned down. He applied for free healthcare at a local hospital but missed appointments and was rejected.
When Case falls ill, he goes to hospital emergency rooms. During his divorce, he experienced severe pain in his abdomen, he said. Emergency-room doctors found that he had untreated stomach ulcers.
Case said his biggest goal – and challenge – is finding steady well-paid work.
“When I was 18, you could leave a job and find another one,” Case said, tucking into an omelet at Burt’s Peppy Grill, a diner in eastern Indianapolis. “Every year, it just gets worse.”
A long journey
As in other parts of the country, the loss of high-paying manufacturing jobs in Indiana has eroded economic opportunities for people with few skills. Seven out of 10 jobs in Indiana now pay less than $45,000 a year, according to the Indiana Institute for Working Families, a think tank. That’s just a few thousand dollars above the income the institute says a three-member Indianapolis family needs to be self-sufficient.
Case now lives on the living-room couches of Joe and a second brother, Tom.

Brandi Burnau is getting by on $180 a month in food stamps and help from a stranger. REUTERS/Aaron P. Bernstein
In October, Case lost his food stamps after a paperwork glitch: The state sent him a letter requesting more documentation, which he said he never got. After he tried and failed to straighten things out, a notification arrived saying he’d been cut off. As of last week, he was still trying to land an appointment with a caseworker to restore his benefits.
Case said his dream is to be an art teacher, something his foster father said is impossible given Shaun’s cognitive and emotional problems. Case said his second choice is to learn a skilled trade such as plumbing or carpentry.
“If you don’t have a good education, you could end up on the street,” said Case. “Five years from now, I don’t know what I’m going to do.”
If he finds work, Case will have trouble getting there. His driver’s license has been suspended. With virtually no income, he fell behind on child-support payments, and so the state has frozen his license.
On a recent day, Case set out for the Indianapolis suburbs, where warehouses operated by Amazon and other companies were advertising jobs. He took two buses and then walked 3 miles, a journey of about two-and-a-half hours, to look for work. He had no luck.
The Real Problem With Welfare: It Stopped Helping the Poor
Mitt Romney has a new ad out accusing President Obama of attempting to “gut” welfare reform by letting states hand out cash to families that aren’t working. At best, the claim seems to be some serious hyperbole surrounding the small kernel of truth that the administration wants to give states more leeway on how they move families into jobs. But hey, it’s the summer, and campaigns need to fill air time, right?
Rather than dwell on this skirmish, let’s remember the bigger picture about the current state of our welfare system, as captured in this graph from the Center for Budget and Policy Priorities. Remember how Bill Clinton promised to “end welfare as we know it?” Well, did he ever.

Clinton’s big idea, if you’ll recall, was to make families work for their cash benefits, which would expire after a few years. He also handed management of the system over to the states. The result: a massively shrunken program. Old-school welfare used to assist the vast majority of impoverished families. Workfare (or Temporary Assistance for Needy Families) reaches just about a quarter of them.
If this was the the result of millions of parents getting jobs and moving up in the world, it wouldn’t be cause for concern. But that’s not what appears to have happened. In 2010, the Government Accountability Office reported that most of the decline had occurred because eligible, impoverished families had simply chosen not to participate.
As the graph below shows, 84 percent of eligible families took part in pre-Clintonian welfare. By 2005, it was just 40 percent.

Why have so many poor families decided to forgo a government check? The GAO concluded that work requirements may have scared some families off — and depending on your political outlook, you might consider that a good thing. But that’s just part of the story. Other families appear to have been discouraged by the endless administrative hoops state agencies forced them to jump through to get into the program. Others were essentially pushed away from TANF by state “diversion strategies.” The GAO also noted that some families may choose to save up their eligibility for an even rainier day, or opt out to keep their incomes low so they can get other government benefits.
In the end, though, we have a half-functioning economy, and one of our safety-net programs for the poorest families has been designed in order to keep as many of them out as possible. That seems like a bigger problem than the possibility that Obama might tinker with a few of its policy details.
Resources
federalsafetynet.com, “Welfare Issues.”; en.wikipedia.com, ” welfare.” by wikipedia editors; theperspective.com, “SOCIAL WELFARE: DO ITS ADVANTAGES OUTWEIGH ITS DISADVANTAGES?” By Kira Goldring; richmondfed.org, “The Shortcomings of a Work-Biased Welfare System.” By Claudia Macaluso; reuters.com, “The Undeserving Poor.” By KRISTINA COOKE, DAVID ROHDE AND RYAN MCNEILL; webarcive.urban.org, “Welfare Reform: An Analysis of the Issues.” By Isabel V. Sawhill; theatlantic.com, “The Real Problem With Welfare: It Stopped Helping the Poor.” By Jordan Weissmann;
Addendum
In short, the current indictment against the welfare system has four particulars:
- It does not provide sufficient state flexibility.
- It does not encourage work.
- It is responsible for the breakdown of the family, especially for a rising tide of out-of-wedlock births.
- It has done little to reduce poverty, especially among children.
The chapters in this volume address how much truth there is in these propositions and assess the ability of current proposals to deal with the complaints. To summarize the findings at the outset:
PROVIDING STATE FLEXIBILITY: States already have substantial flexibility; they could be provided more without eliminating the current federal role in securing a safety net for the poor. Block grants will lead to new inequities and to insufficient public accountability.
ENCOURAGING WORK: Encouraging work among welfare recipients necessitates that funds be provided for this purpose. But, according to several authors, what is required is not so much major new investments in education and training as resources devoted to helping people find jobs in the private sector.
One way to encourage work is to cut off cash assistance. A set of proposals similar to the House-passed Personal Responsibility Act (PRA) ultimately would deny benefits to about 42 percent of the current caseload and reduce benefits for an additional 30 percent. But because of their poor education and other characteristics, most of those denied assistance would have difficulty finding and holding jobs. Based on the experience of those terminated from General Assistance in Michigan, as many as two-thirds could remain unemployed.
REDUCING OUT-OF-WEDLOCK BIRTHS: The majority of women on welfare had their first child as a teenager. Most of these births now occur outside of marriage and are unintended. However, there is little support in the research literature for the proposition that denying benefits to this group will prevent such pregnancies from occurring. Modest impacts on marriage and abortion are more likely.
REDUCING CHILD POVERTY: Moving more children out of poverty requires that income from a low-wage job be combined with child care, health insurance, the Earned Income Tax Credit, and support from both parents. Child support reform in particular could reduce poverty and welfare costs as much as anything else that recently has been proposed.
At the same time, for budgetary reasons the broader safety net is predicted to shrink. The PRA alone provides 13 percent of the total five-year savings in the House budget resolution. Thus, even if no other low-income program such as Medicaid were affected by attempts to balance the budget, the poorest fifth of the population (which receives 4 percent of total U.S. income) would bear a disproportionate share of the burden.
In sum, measured against the objectives of providing adequate flexibility to the states, encouraging work, strengthening the family, and reducing poverty, most current proposals are found wanting.
LEGISLATIVE HISTORY
While there is considerable consensus that welfare needs to be reformed, there is less agreement about exactly what needs to be done and a long history of past attempts that have proved less than satisfactory or had little staying power.
The most recent round of reform occurred in 1988, when Congress enacted the Family Support Act. It combined an emphasis on moving people into jobs with increased funding for the education and training believed necessary to make this possible. The education and training were to be provided by a new program called Job Opportunities and Basic Skills (JOBS) in which most welfare recipients would be required to participate. Many states are only now beginning to implement fully the philosophy and work-oriented programs contained in the Family Support Act. Nationwide, about 23 percent of able-bodied welfare recipients without a child under age 3 are now participating in JOBS.
As a governor, President Clinton was a strong proponent of the Family Support Act, but he campaigned for the presidency on a pledge to “end welfare as we know it.” Legislation embodying the details of his plan was introduced in 1994 as the Work and Responsibility Act. It built on the Family Support Act philosophy by investing still more in education and training but set a two-year time limit, after which welfare recipients would either have to work or lose their benefits. With appropriate assistance and the push of a time limit, it was hoped that most recipients would find jobs before their two years were up, but for those who did not, subsidized work opportunities were to be made available. The two-year limit was to be phased in slowly, starting with those born after 1971. This phase-in had three advantages: it sent a message of personal responsibility to the younger generation; it gave states time to expand their ability to provide the necessary training and work opportunities; and it made the budgetary costs of the plan more manageable.
The Clinton plan was eclipsed, first by the focus on health care reform, and later by the 1994 election which led Republicans in the House to propose a new plan, the Personal Responsibility Act, which differed sharply not only from Clinton’s plan but also from their own earlier reform proposals. The PRA, enacted by the House on March 24, 1995, goes far beyond simply reforming welfare. It creates a number of new block grants focused on cash assistance, child nutrition, child protection, and child care. It also contains fundamental reforms of the Food Stamp program, Supplemental Security Income (SSI) for the low-income disabled, and the major means-tested programs serving legal immigrants. Overall, it saves almost $70 billion over the next five years (see figure). Its more narrowly defined “welfare” component not only turns the current Aid to Families with Dependent Children (AFDC) and JOBS programs into a block grant with flat funding for the next five years, but also contains a number of prohibitions. Notably, no federal funds are to be used to pay benefits to unwed minor mothers, to children born to mothers on welfare, or to those receiving welfare for more than five years.
Most governors strongly support the increased flexibility inherent in block grants but are unhappy with the prospect of new federal prohibitions and privately nervous about the implicit cost shifting to lower levels of government . As this goes to press, the Senate Finance Committee has endorsed the block grant approach adopted by the House but has omitted some of the prohibitions most disliked by governors.
Whatever the outcome of the legislative process, the chapters in this volume make one thing abundantly clear: the issues are much more complex and reform much more difficult than is generally recognized. Predicting the consequences of reform is equally difficult, a problem with which all of the authors of this volume have had to grapple.
ISSUE ONE: THE FEDERAL ROLE IN MAINTAINING A SAFETY NET
FINAL ASSESSMENT
Congress is now deliberating legislative and budgetary changes that would dramatically redefine the nation’s responsibilities for the least advantaged. Debate about these responsibilities should be welcomed and new ideas given careful consideration. It is not written in stone or in the Constitution that the federal government needs to take care of the poor. Current programs are widely viewed as deficient, in large part because they are perceived as encouraging dependency and the dissolution of the family. In some areas, the federal role has become too intrusive. And without new taxes, money is in short supply. Returning responsibility to the states with a tie-off grant from the federal government to ease the transition is seen by many as the solution.
In my own view, arguments that current proposals are the best means of dealing with these problems are somewhat disingenuous. As many have argued, these proposals could more accurately be described as a Trojan horse designed to dismantle the welfare state that has existed for the past 60 years. If the objective is to encourage work and marriage, these reforms send the right signals but may disappoint in practice. If the objective is to provide states with greater flexibility, the solution is a streamlined waiver process and other modest reforms. States already have a great deal of flexibility and could readily be given more within a framework that establishes minimum protections for the poor and accountability for the public’s money.
If the objective is to reduce the deficit, this could be achieved without cutting so deeply into programs that help the most vulnerable. The poorest 20 percent of the population now receives roughly 4 percent of all income in the United States. Any deficit reduction package that asks them to pay more than 4 percent of the total burden is arguably unfair. Yet chances are that they will end up paying far more than this. Deficit reduction is a worthy goal, but numerous tax subsidies and entitlement programs could be tapped before low-income programs were cut. As it is, safety-net programs are being restructured in ways that not only yield federal savings but also promise less state effort as well.
Finally, if the objective is to reduce poverty without encouraging dependency, the most important thing that government can do is to assist low-income working families with such measures as the EITC, child care, subsidized health insurance, and adjustments in the minimum wage. If personal commitments to work and family are the surest way out of poverty, as they have been in the past, then these work-oriented measures are the best way to keep those who play by the rules from falling further behind.
Figure 1

Welfare Reform: An Analysis of the Issues
ISSUE ONE: The Federal Role in Maintaining a Safety Net
Currently, welfare (AFDC) is an entitlement under which funds flow to all eligible individuals on the basis of need. The federal government pays anywhere from 50 to 80 percent of the costs, depending on the state. Under current proposals, individuals would no longer be entitled to such assistance and states would be given a fixed amount of money that would no longer vary with the number of families needing assistance. These proposals to “block grant” federal funds and return more responsibility to the states are analyzed in the first three chapters of this volume. The authors note that the main effect would be to shift not just responsibilities but also costs to the states, which may unleash a competitive scramble among them to reduce funding for the poor.
Although such proposals are commonly referred to as “block grants,” it should be noted that the term normally means a consolidation of small categorical programs with a similar mission not a capping of funds for an entitlement program. In this sense, the proposals currently being considered are unprecedented. As George Peterson notes in Chapter 1, the PRA would increase the proportion of federal aid to states given in the form of block grants from 7 to 24 percent.
These block grant proposals are intended to provide states with greater freedom from federal rules and to produce more effective programs and lower administrative costs in the process. But states already have a great deal of flexibility. Under current law, they can set benefit and eligibility levels, which results in widely different benefit levels ranging from as little as $1,440 a year for a three-person family in Mississippi to $7,284 a year in California (partially offset by federally set food stamp benefits, which are higher for those receiving smaller AFDC checks) . In the past, welfare reform often has focused on the need to provide more uniform benefits across the country. Current proposals, perhaps unintentionally, move in the opposite direction and would almost certainly exacerbate interstate inequities.
Flexibility is further enhanced under current law by the fact that states can apply for waivers from federal rules. The application process is cumbersome and ought to be streamlined, but the majority of states are now operating under such waivers. One unintended consequence of reform may be to eliminate the opportunity to learn what works from the evaluations required as part of the waiver process.
The extent to which additional flexibility will reduce administrative costs is unclear, but George Peterson suggests the effects are likely to be small. (In Chapter 5, Lawrence Mead argues that if the objective is to move welfare recipients into the work force, states will need to spend more, not less, on administration of the program.)
A major concern is how states will cope should an economic downturn, a rising poverty rate, or other factors lead to greater need for assistance. The PRA contains a “rainy day” fund that is intended to address this issue. Wayne Vroman in Chapter 3 concludes that the fund as proposed is insufficient to meet the likely need. During the 1989-92 recession, for example, AFDC caseloads rose by about 11 percent. Handling a recession of this magnitude would require a rainy day fund of a little less than $3 billion, compared to the $1 billion contained in the PRA. Coping with population growth alone would require another $700 million over the next five years, in contrast to the $100 million in the PRA.
If the goal were to keep up with the growth of poor, female-headed families, the $700 million figure would need to be still larger, possibly as much as $1.7 billion. In the end, however, the most basic issue may be what Paul Peterson in Chapter 2 calls “the race to the bottom” and George Peterson calls “spiraling parsimony” the likelihood that states will reduce benefits to the poor out of a fear that they could become a haven for the most disadvantaged and drive away businesses and middle-class taxpayers in the process.
The fundamental question here is whether we should abandon the broad national purpose of reducing poverty. Those who argue for a continuing federal role do not necessarily assume that the states are uncharitable in their attitudes toward the poor. They only assume that any one state, acting generously, risks the possibility that its neighbors will not follow suit and that it will be left with disproportionate responsibility for the poor. In the absence of such “free rider” problems, there would be no role for the federal government. We could rely on states not only to help the needy but to fund all kinds of public goods. The argument is most clear-cut in the case of defense. No one doubts that if defense spending were left entirely to lower levels of government the military would be seriously underfunded. Whether a similar argument applies in the case of antipoverty spending is now the issue.
Welfare Reform: An Analysis of the Issues
ISSUE TWO: Encouraging Work
Virtually all recent reform proposals assume that the best alternative to welfare is work. In Chapter 4, Robert Lerman observes that policymakers have relied on a combination of three tools to increase employment and earnings: financial incentives, job search and work requirements, and education and training.
Financial incentives encourage recipients to work by allowing them to keep more of their welfare check after they go to work. (Many states are now experimenting with such incentives under federal waivers.) It would be surprising if those currently on welfare did not respond favorably to such incentives. But because such initiatives raise the income eligibility cutoff point for welfare, and thus allow more people to qualify, their net impact may be to increase rather than reduce welfare caseloads and costs. For this reason, past attempts to reduce welfare dependency by increasing the incentive to work have proved disappointing.
The other alternatives are to insist that welfare recipients work or to provide them with education and training. The evidence suggests that programs focusing on education and training produce positive results but are not as cost-effective as those that emphasize work and require people to find a job as soon as possible (with an option to pursue further education once they are headed toward self-sufficiency).
In Chapter 5, Lawrence Mead elaborates on this theme by reviewing the characteristics of successful JOBS programs in places like Riverside, California, and Kenosha, Wisconsin. He agrees with Lerman that work requirements are important and asserts that too little attention has been paid to the quality of administration at the local level, which is critical to enforcing such requirements. His research suggests that states like Wisconsin, with effective JOBS programs, have successfully reduced welfare caseloads without resorting to arbitrary time limits or other sanctions. The federal role, in his view, should be to set strong work participation requirements and to provide financial incentives for states to achieve these standards.
If a key goal of welfare reform is to move recipients into jobs, they will need day care for their children, an issue addressed by Sandra Clark and Sharon Long in Chapter 6. Their overview of current federal initiatives notes that it is the working poor who receive the least child care assistance.
The largest federal child care program is the Dependent Care Tax Credit which, because it is not refundable, provides assistance primarily to middle- and higher-income families. Several other programs focus their resources on AFDC recipients who are in training or making the transition into jobs. This leaves the Child Care and Development Block Grant as the main source of assistance for low-income working families, whose need for assistance, according to these authors, far exceeds the supply of subsidized care. Assuming that welfare reform successfully moves recipients into jobs, this need can only increase. Yet Congress is contemplating block granting the child care programs serving low-income families and cutting the funds by 9 percent.
Child care assistance for low-income working families is only one way of ensuring that work pays more than welfare. Also needed, Lerman notes, are health insurance, child support, and the EITC. Without these, welfare reform may satisfy the public demand that people work in return for assistance, but will move very few families out of poverty.
Welfare Reform: An Analysis of the Issues
ISSUE THREE: The Effect of Time Limits
Current proposals would permit states to establish their own time limits for AFDC but deny federal funds to those on welfare longer than five years. The question addressed in Chapters 7, 8, and 9 is the likely consequences of cutting off all cash assistance.
In Chapter 7, LaDonna Pavetti finds that welfare recipients often leave the rolls within a year or two but many return almost as quickly. Looked at over a lifetime (that can include multiple spells), 42 percent end up receiving benefits for less than two years. Only 35 percent stay on for more than five years. Because these long-stayers accumulate on the rolls, however, 76 percent of current recipients are in the midst of a five-year or longer stay. Moreover, these long-stayers are a particularly disadvantaged group. Half enter AFDC with no work experience and 63 percent have less than a high school education.
In Chapter 8, Sheila Zedlewski and I estimate the effects of the PRA on welfare caseloads and costs and assess how states and individuals are likely to respond. We find that if the PRA were fully in effect, about 42 percent of the current caseload would lose their eligibility (primarily because of the time limit) and another 30 percent would receive lower benefits. (Because the new rules would be phased in gradually, not all these effects would occur immediately.) As eligibility and benefits were cut, federal and state welfare costs would shrink commensurately. But it would take time for these savings to materialize. In the shorter run, states would have to use their own resources to finance any growth in the caseload induced by a recession or demographic trends, as well as any expenses associated with moving people into jobs. These estimates of the effects of the PRA assume no changes in individual or state behavior, both of which are likely in response to the federal policy and budget changes now under consideration. Individuals are likely to work more under the threat of a benefit cutoff, while states are likely to spend less under a fixed block grant, with ultimate effects that are difficult to predict.
A more critical issue is what happens to recipients who lose all eligibility for welfare as the result of a federal or state time limit. Sandra and Sheldon Danziger argue in Chapter 9 that many recipients reaching a time limit will seek but not find steady employment. They base this conclusion on a number of studies of the low-wage labor market, but particularly on the experiences of former recipients of General Assistance in Michigan, a program the state terminated in 1991. Looking at the principal source of cash support received by this group two years later, they find that only 20 percent were employed in a formal job while another 17 percent held casual jobs. More than a third had found their way onto other benefit programs (most frequently disability benefits), and the remainder were relying on family or friends or had no known source of income. Looking just at a subsample of this group with characteristics similar to those on AFDC, the Danzigers find that 46 percent of them were employed if they had at least a high school degree and 28 percent if they did not. Combined with Pavetti’s evidence on the characteristics of long-stayers, this suggests that only about one-third of welfare recipients who lose assistance after five years are likely to be employed two years later.
Welfare Reform: An Analysis of the Issues
ISSUE FOUR: Preventing Dependency
Precisely because it is so difficult to make welfare recipients self-sufficient, there is a growing consensus that more effort should be devoted to preventing dependency in the first place. This means paying attention to a wide range of issues, including declining job prospects for the unskilled (especially men) and widespread deficiencies in the education system. However, two problems believed to be closely linked to welfare dependency have received special attention: rising rates of out-of-wedlock childbearing, especially among teenagers, and low levels of child support from the fathers of children on AFDC.
In Chapter 10, Freya Sonenstein and Gregory Acs note that the teenage birth rate declined steadily during the 1960s and 1970s, leveled off in the first half of the 1980s, and increased again starting in 1986. Rising rates of sexual activity throughout this period exposed a larger and larger proportion of adolescents to the risk of pregnancy. At the same time, greater use of contraception and abortion kept the birth rate trending downward until the mid-1980s. Since then abortion rates have fallen, and this together with a shift in the composition of the teenage population toward demographic groups with higher fertility rates, such as Hispanics, appears to explain the post-1986 rise.
Contrary to conventional wisdom, teenagers are not a large part of the AFDC caseload. Moreover, among those on welfare, few establish separate households; most live with their parents. In 1992, only 8 percent of the AFDC caseload consisted of women under the age of 20, and for women under 18, only 18 percent lived alone with their children. But the majority of mothers on AFDC (52 percent) had their first child as a teenager, and research has implicated early childbearing as one factor predicting subsequent poverty and welfare dependency.
While the teenage birth rate is now lower than it was in the 1960s, the proportion of such births that occur outside of marriage has increased dramatically. In Chapter 11, Acs takes up the question of whether welfare induces women to have children outside of marriage. (Out-of-wedlock childbearing, it should be noted, is not confined just to teenagers. In fact, in 1992, only 30 percent of all nonmarital births were to women under the age of 20.)
Acs notes that, in inflation-adjusted terms, welfare benefits have been declining at the same time that out-of-wedlock childbearing has been increasing. Moreover, there is little correlation between the generosity of the welfare system in a state and its nonmarital birth rate, even after adjusting for factors that might otherwise obscure welfare’s true effect. Some studies find an association between welfare benefit levels and nonmarital births among whites. But the overall impression from all the studies so far, using a range of data and methodologies, is that welfare has, at most, a small influence on out-of-wedlock childbearing .
In the end, as Acs notes, one cannot confidently extrapolate from this body of research which has examined the effects of relatively small variations in welfare benefits on behavior to predict the consequences of the major changes now under consideration. Further, both he and Sonenstein suggest that welfare is much less likely to affect sexual behavior than it is to affect the decision to have an abortion or to marry, once pregnant. Thus, welfare reform proposals that deny benefits to young unwed mothers, or cap benefits for those who have additional children on welfare, are more likely to affect abortion or marriage than pregnancy itself.
Marriage is only one way to bring fathers back into the picture. Requiring that they pay child support is another. In Chapter 12, Elaine Sorensen reviews the potential of this strategy to reduce poverty and welfare dependency. Under an ideal child support system defined here as one that uses the Wisconsin child support guidelines and collects all child support in full an additional $34 billion could have been collected in 1990. Almost three-fifths of this uncollected child support results from not having a child support award in place (often because paternity is not established). The remainder is due to inadequate or uncollected awards.
Not all of this $34 billion in potential child support would go to the children of those on welfare (or to the governments that support them). Many of the fathers of these AFDC children are themselves poor and would not be expected to pay much, if any, child support. Sorensen estimates that perhaps 13 to 26 percent of all noncustodial fathers are in this unable-to-pay category. In addition, a lot of uncollected child support is owed to children who are not poor and not on AFDC. For these reasons, the potential of a better child support system to reduce poverty and welfare dependency is not as great as the $34 billion figure might imply.
Nonetheless, Sorensen estimates that, had an ideal child support system been in place in 1989, the number of poor individuals would have dropped by 1.4 million (5 percent), the number of families on welfare by 400,000 (9 percent), and welfare costs by $5 billion (9 percent) .
Although $5 billion in savings is small in comparison to the $34 billion in uncollected support, it is large relative to the annual savings associated with recently proposed reforms such as the PRA, which entails savings of no more than $2.6 billion in the fifth year after enactment. Moreover, the savings due to increased child support are achieved not by placing new burdens on poor mothers, but by requiring those who can afford it to support their children.
Welfare Reform: An Analysis of the Issues
ISSUE FIVE: The Broader Safety Net
When people talk about welfare reform they usually focus primarily on the AFDC program. But the current safety net is much broader than this and includes food stamps, SSI, Medicaid, and a number of smaller programs. The final three chapters analyze the proposed changes in some of these other low-income programs .
In Chapter 13, James Ohls notes that the Food Stamp program, which now provides benefits to one out of every 11 Americans, is the ultimate safety net. Unlike any other program, it involves a federal commitment to place a floor under every income, regardless of where a person lives or in what type of household. Although its support is restricted to food assistance, its impact may be less on nutrition than on providing low-income families with a source of purchasing power. (Studies indicate that households given stamps spend somewhat more on food than those given an equivalent amount of cash, but stamps free up for other purposes resources that otherwise would have been spent on food.)
AFDC benefit levels vary widely by state. The Food Stamp program cuts this variation in half because food stamp benefits increase by 30 cents for each dollar reduction in AFDC benefits. Food stamps also help communities adjust to economic changes since they are available to more families when unemployment increases and are indexed to keep pace with inflation.
The PRA proposes to cut food stamp costs, increase state flexibility, and require more work. Cost-of-living adjustments would be reduced to 2 percent a year and the allowable shelter deduction frozen, progressively weakening the inflation protection of food stamps. States would be given flexibility to change the food stamp eligibility and benefit rules for their AFDC caseload and their total caseload, if they opted for electronic benefit transfer (EBT) instead of paper coupons. Finally, a work requirement would make able-bodied prime-age adults without dependents ineligible after three months, unless they were employed at least half time or were in a work or training program. (Only minimal funding $75 million is provided to help them find jobs.)
The proposed changes would produce five-year savings estimated at $23 billion. They would cut benefits (compared to the current program) by 21 percent over five years and by up to 30 percent over ten years.
As Ohls points out, in this era of budget constraints, it may be reasonable to include the Food Stamp program in the search for cost savings, more work effort, and greater flexibility for the states. But it is not necessary to remove the entitlement status of the Food Stamp program or federal responsibility for eligibility and benefit standards in order to achieve these objectives.
In Chapter 14, Pamela Loprest examines proposed changes in the SSI program for children with disabilities. The number of children receiving SSI has more than doubled over the past five years. The reasons are not fully understood but include court cases and administrative changes that have liberalized eligibility along with aggressive outreach. Press accounts have suggested that some of the growth also may be due to fraud and abuse for example, parents coaching children to “act crazy” in order to make them eligible. The Social Security Administration has found no clear evidence of such abuses. All in all, though, many experts and policymakers believe that some tightening of the eligibility rules is needed, and Congress established a Childhood Disability Commission in 1994 to review the current situation and recommend reforms. In the meantime, the PRA has called for a dramatic restructuring of SSI without the benefit of such a review. If enacted, the PRA would deny cash assistance to most of the disabled children in low-income families who now receive it. Instead, the bulk of them would be eligible for Medicaid and for services to be funded by block grants to the states. Of all new applicants who would be eligible for cash benefits under current rules, 21 percent would continue to receive these benefits (on the grounds that they are institutionalized or at risk of becoming so), 61 percent would receive block grant services, and 18 percent would be ineligible for either cash or services (because they do not have a specific, medically listed disability).
Many other approaches to reforming SSI for children are possible. The choice depends on a fuller understanding, and agreement among professionals in the field, of what constitutes a disability and on the overall objectives and philosophy of the program. Some believe SSI should continue to provide cash benefits to low-income families who have the additional burden of caring for a disabled child; others believe it should focus on providing just the specific medical care or other special services needed by the children themselves as a result of their disabling condition.
Chapter 15 by Michael Fix and Wendy Zimmermann turns to the question of what benefits should be made available to immigrants. As they note, illegal immigrants are currently ineligible for all benefits with the exception of emergency medical care, child nutrition, and education. Legal immigrants, in contrast, have traditionally been eligible for most benefits on the grounds that they pay taxes, can be drafted in time of war, and should be as fully integrated into American society as possible. It is also argued that making citizenship the gateway to receipt of benefits would induce many people to seek it simply to qualify for benefits and place a substantial administrative burden on an already hard-pressed Immigration and Naturalization Service.
The PRA would change dramatically the rules for legal immigrants by denying most of them access to AFDC, SSI, food stamps, Medicaid, and other social services. They would continue to be eligible for other means-tested programs if their sponsor’s income were low enough. The effects would be concentrated in the small number of states where immigrants are concentrated New York and California in particular. These and other affected states would have to decide whether to pick up the responsibilities shed by the federal government or to pass them along to local governments and nonprofit institutions.
Fix and Zimmermann note that legal immigrants’ current use of cash assistance programs is only slightly higher than that of natives and is heavily concentrated among two groups: refugees on AFDC and the elderly on SSI. They suggest that any concern about excessive use of public benefits by immigrants should focus on these two groups. They also lay out four principles (and some specific ideas) that might guide reform more generally: the need to prevent an influx of immigrants seeking to benefit from U.S. generosity; the need to promote family not government responsibility for new arrivals; the need to provide at least a temporary safety net for those who later fall on hard times; and the need to make a distinction between programs that provide income assistance and those that provide education, training, or other services that promote the integration and upward mobility of new arrivals.
Chapter 1
A Block Grant Approach to Welfare Reform
by George Peterson
Current welfare reform proposals have revived debate over devolving welfare policy to the states and financing the transfer by block grants. The welfare legislation recently passed by the House would consolidate a broad array of programs into a few block grants (see Figure 1).
This block granting would:
- End automatic, universal eligibility for those who meet federal program criteria, and
- Allow the states to design fundamentally different programs to achieve very broadly defined national objectives.
WHAT ARE BLOCK GRANTS?
The term “block grant” carries different meanings for different protagonists. A standard block grant might:
- Consolidate a number of federal categorical programs and give state (or local) officials more discretion about how to use federal funds across categories,
- Fix federal allocations in advance. Future funding is not tied to changes in the number of eligible beneficiaries or payment levels, and
- Reduce federal regulation and oversight. Within broad federal goals, states can spend more effort designing programs that serve their ends and less effort reporting to the federal government.
A BRIEF HISTORY
The concept of block granting is rooted in perceived defects of the categorical grant system. Proposals to combine categorical grants into broad blocks of programs began shortly after World War II, almost as soon as categorical assistance became a significant item in the federal budget. Most of the early criticism of categorical grants focused on the administrative complexity of overseeing local programs from Washington and the handcuffing of local initiative.
The Nixon New Federalism attack went further. It viewed categorical grants as the ideal instruments of Congress – “the porkiest of the pork,” in one Nixon official’s description – because they delivered identifiable program benefits to narrowly drawn constituencies for which members of Congress could take credit. When Nixon proposed to combine categorical grants into “special revenue sharing” that transferred program authority to the states, the administration’s political science analysis was at least partly vindicated. The special revenue sharing concept was rejected by Congress in an intensely partisan debate. Only some small block grant consolidations survived.
Block grants made their greatest inroads during the Reagan presidency, with nine block grants approved by Congress, mostly in community and social programs and health services. Before Reagan, essentially all block grant proposals had contemplated increased federal funding. Reagan introduced the strategy of using block grants to cut federal spending, arguing that, once freed from federal red tape, the states could accomplish the same programmatic ends with less outlays.
Throughout the history of block grants—as shifting political alliances combined with concern over whether federal dollars were reaching the targeted populations—Congress tended to follow initial consolidation with reimposition of some programmatic restrictions.
Despite the long history of debate, block grants today constitute a small proportion of the intergovernmental budget. All block grants together accounted for less than 7 percent of federal assistance to state and local governments in 1994, down from 11.3 percent in 1980. Current proposals would increase this share to 24 percent. Several programs now proposed for block granting are much larger than anything transferred to states in the past (see Figure 2, and Figure 3).
BLOCK GRANTS VS. ENTITLEMENTS
The entitlement nature of AFDC and food stamps has long defined the United States safety net against poverty. The current consensus, however, seems to be that cash payments to welfare families should not be a lifetime entitlement. Most recent welfare reform proposals place a time limit of some kind on family eligibility. There is no consensus about food stamps. Currently, food stamps afford the final, universal safety net for poor families, with a single national eligibility standard and a single national payment standard. Indeed, the Food Stamps benefit formula reduces overall benefit disparities among states, providing higher benefits in states with lower AFDC benefit levels.
Block grants in the form proposed will make it difficult for states to maintain existing benefits in the face of recession or demographically driven poverty growth. Federal funding for cash assistance would be frozen at $15.4 billion a year for the next five years. There are provisions for a Rainy Day Fund that would allow states to borrow to supplement funding in recessionary periods (to be detailed in Welfare Reform Briefs Number 4). But federal funds are unlikely to stretch enough to absorb the number of families that ordinarily would become eligible over the period. Financially hard-pressed states will be forced to choose among using their own funds to sustain welfare programs, restricting entry, or cutting back benefits.
STATE EXPERIMENTS
House Speaker Newt Gingrich has remarked that block granting should unleash “51 state experiments” in welfare reform. How the nation will accommodate to, or learn from, these experiments, however, is not clear. Currently, if a state desires a waiver from federal regulations to introduce its own approach to welfare, it must submit to the federal government a plan for monitoring and evaluating the outcomes of this experiment. Results are then available for other states to use in designing their programs. Most governors and many federal administrators believe the current waiver process is too time-consuming. Oregon, for example, had to wait a year for its welfare and work program to be approved. Others feel that the monitoring and evaluation procedures imposed by the federal government are too costly and too rigid.
The proposed block grants run to the other extreme. There are no evaluation requirements. In fact, the AFDC replacement block grant is drawn in such a way that meaningful state comparisons may be impossible. The laboratory of federalism would be generating many welfare experiments, but no systematic evaluation of the results.
Perhaps most fundamentally, devolution of welfare to the states is likely to set off a competitive scramble to cut benefits and limit eligibility. States are already fearful of becoming “welfare magnets.” As states become freer to construct their own programs, this fear is likely to escalate. The specter of migration of the poor (or, more plausibly, of the affluent in response to the costs of providing for the poor) has plagued local welfare programs from the days of the English Poor Laws. The almost inevitable outcome of such a system is spiraling parsimony, as every state scrambles to avoid becoming a welfare haven that treats the poor more generously than its neighbors.
FEDERAL RESTRICTIONS
An ideologically pure block grant would turn over essentially all program design authority to the states. The National Governors’ Association has endorsed a block grant approach that would place no restrictions on the welfare replacement programs that states devise.
Federal legislation is not moving in this direction. The House bill incorporates a number of prohibitions and mandates that would limit state discretion and increase state costs. For example, requirements would mandate that states place 10 percent of the adults on welfare rolls in jobs in fiscal year 1996 and 40 percent in FY 2003. Governors have complained that meeting these requirements would be costly (in terms of state—financed job training, child care, employer wage subsidies, or other measures); some states would find it difficult to meet the targets at any cost.
Other prohibitions built into federal legislation would prohibit states from using federal funds to pay for welfare benefits to legal immigrants who are not citizens, or support unwed mothers who have children before the age of 18. These restrictions impose broad policy limits on the kinds of welfare programs states can design, though states could use their own funds to finance such programs.
BUDGET-CUTTING ROLE
Today’s block grants are an instrument of budget cutting. Many of the block grants now proposed would have their federal funding levels frozen for five years without adjustment for inflation or growth in the poverty population. Others would grow much more slowly than their categorical predecessors have done. In effect, block grants shift the fiscal risks of dealing with recession and any future poverty growth to the states and, ultimately, to families.
Block grants also eliminate state matching requirements and thereby fundamentally change the financial incentives now built into the system. Under the current, open-ended matching grant structure of AFDC and Medicaid, states have theoretically had an incentive to expand benefits and coverage, because the federal government picks up a large share (between 50 percent and 80 percent, depending upon state income) of additional costs. Savings from program cutbacks are shared with the federal government in the same proportion. Under block grants, federal payments are fixed. States would enjoy 100 percent of any program savings they generate. The change in incentives should have substantial impact. When the open-ended matching program for social services was capped and converted to a block grant, rapid state spending growth was halted almost overnight.
ADMINISTRATIVE SAVINGS
In theory, block grant expenditure reductions are compensated by administrative savings, so that the impact on beneficiaries is muted. But state “administrative” savings from previous block grants have proved difficult to isolate. States have cut back on reporting to the federal government and, often, on program monitoring. This has yielded monetary savings. Program debate often suggests that administrative savings on the order of 15 to 20 percent will be possible, but follow-up studies have found highly variable savings that administrators claim rarely exceed 5 percent. Larger savings require using the new administrative flexibility to eliminate program features or cut back coverage—i.e., real program reductions. Still, savings of even 5 percent in the welfare area can generate substantial sums of money—around $1 billion nationwide, based on the $28 billion a year currently spent by federal and state governments on AFDC.
CONSISTENCY OF REFORM
It is tempting to compromise between different approaches to welfare reform by simply block granting some programs, like AFDC, while leaving others, like Food Stamps, as open-ended federally defined entitlements. There is a danger to this approach, however. It encourages states to cut back still further on welfare programs, confident that federal Food Stamps will absorb part of the reductions. This process increases federal budget costs, and makes federal spending a captive of state calculations as to how to most effectively shift spending burdens to the one remaining entitlement program.
THE REAL CHOICE
The welfare debate has developed in a manner that identifies block grants and state choice as the only alternatives to the status quo. This oversimplifies the real choice. Congress and the President must decide, first, what national principles will guide the nation’s anti-poverty policy and which programs, if any, should remain national entitlements. The current set of block grant proposals incorporates a particular view of the national interest in welfare programs—one that emphasizes limiting federal budgetary exposure.
George E. Peterson is a senior fellow at the Urban Institute.
Figure 1

Figure 2

Figure 3

Chapter 2
State Response to Welfare Reform: A Race to the Bottom?
by Paul Peterson
The House of Representatives approved legislation in the spring of 1995 that would eliminate Aid to Families with Dependent Children (AFDC) as an entitlement. In its place, the House bill gives each state a block grant equal to the AFDC funds the state received in the 1994 fiscal year. The terms of the block grant allow each state to set—within very limited guidelines—its own eligibility standards and benefit levels.
Such a dramatic shift in policy, if approved by the Senate and signed by the President, is likely to prove unworkable and short-lived, simply because such alterations run at odds with the underlying structure of the federal system. If welfare policy is permanently turned over to the lower tiers of government, states will find themselves in a “race to the bottom”—a race to cut welfare benefits faster than their neighbors, thereby endangering the well-being of the most marginal members of society, including large numbers of children living in poverty.
THE UPS AND DOWNS OF STATE WELFARE POLICY
Welfare policy was first formulated at the state level. AFDC itself owes its origins to state-run “mother’s pensions” programs first set up in 1911 in Illinois and Missouri, long before the federal government incorporated family assistance into the Social Security Act of 1935. Because AFDC evolved out of state-operated programs, it always has been jointly financed by federal and state governments. States still retain full authority to set the AFDC benefit level and still determine many eligibility requirements.
Initially, state control did not preclude a steady rise in welfare benefits. The mean benefit paid to a family in the average state climbed (in 1993 dollars) from $306 in 1940 to $429 in 1950, $520 in 1960, and $605 in 1970. State AFDC policies began to change around 1970, a retreat that has accelerated with time. Even by 1975 the mean cash benefit in the average state had slipped to $512; by 1993 it had reached its postwar nadir of $349. All in all, the cuts between 1970 and 1993 amounted to no less than 42 percent.
In 1988, the Family Support Act explicitly gave states additional opportunities to experiment with AFDC. In keeping with a growing conservative mood at the state level, the first three major proposals submitted to the U.S. Department of Health and Human Services all proposed new restrictions on welfare. California proposed an immediate 25 percent reduction in benefits, a further reduction for all families remaining on welfare after six months, and a limit on benefit levels for new arrivals to the state to the level they were receiving in their previous state of residence. Wisconsin and New Jersey petitioned, among other things, to withhold the increase in benefits that typically came with the birth of an additional child. What began in a few states soon spread nationwide, and by now a majority of states have used the flexibility available under the 1988 legislation to restrict further AFDC eligibility and benefits.
These reductions in welfare benefits hardly can be attributed simply to newly conservative state political climates. Statistical studies indicate that it made little difference to benefit levels whether control of state legislatures was in the hands of Republicans or Democrats. For much of the period, Democrats controlled at least part of state government in most states, and in a substantial number they controlled both houses of the state legislature as well as the gubernatorial chair.
More important than politics was the increasing integration of the national economy. Capital, entrepreneurial activity, and labor have become more mobile, making states increasingly sensitive to the economic consequences of their policies. Today, 17 percent of the population changes residence each year, and 3 percent moves across state lines. States and localities can no longer make policy choices as if they are acting in isolation. The decisions they make are noticed by people elsewhere, and the impact on their economic and fiscal situation will be felt sooner rather than later. The result is that state officials are growing ever more reluctant to provide for the needy within their jurisdictions.
THE WELFARE MAGNET
States whose welfare benefits remain relatively high have become welfare magnets – places that attract poor people because they offer higher cash benefits than do many other states. The higher the benefit, the more magnetic the state—both by keeping poor people from moving elsewhere and by attracting additional poor people into the state. The lower the benefit, the more repellent the state is to poor people—both by encouraging poor residents to leave and by deterring other poor people from moving to the state. Low-income, welfare-dependent families move at least as frequently as other demographic groups.
The welfare magnet is a function of the great variation in welfare benefit levels among states. In 1991 the maximum annual combined cash and food stamp benefit for a family of four varied between $5,952 in Mississippi and $11,898 in California. The variation in cash benefits was even greater in 1990 than it had been in 1940. Although the food stamp benefit reduces interstate variation considerably, interstate variation in combined cash and food stamp benefits remains much greater than interstate variation in the cost of living.
Before 1970, welfare policies had little magnetic effect. Numerous state laws and administrative practices designed to impede access to the welfare system made it inadvisable to change residences merely to improve one’s welfare opportunities. Among the many restrictive practices was a rule, applied by many states, denying welfare benefits to poor families for a full year if they moved into the state from beyond state borders. Thus, before 1969, the states could increase their welfare benefits without becoming a more attractive place to live for poor people in other parts of the country.
In 1969 the Supreme Court ruled that the denial to newcomers of welfare benefits granted to longer-term residents in the state of New York violated the Fourteenth Amendment’s requirement that states provide citizens equal protection before the law. This decision, together with the liberalization of numerous other state administrative practices, facilitated access to the welfare rolls, especially for those moving from one state to another.
But even as court decisions were forcing states to liberalize their newcomers’ access to AFDC benefits, state officials became increasingly concerned about their states becoming welfare magnets. Their concerns seem to have been well placed.
Between 1971 and 1985 the size of the low-income population increased somewhat more rapidly in states with higher benefit levels. Though modest, the magnet effect remains noticeable even when differences in economic conditions among the states are taken into account.
Fearful of becoming welfare magnets, many states have cut their welfare benefits. The governor of Wisconsin openly worries about the influx of poor people from Illinois, which has lower welfare benefits. Policymakers in New Hampshire are currently rushing to pass a welfare “reform” for fear that recent benefit cuts in Massachusetts will induce a northward move among potential welfare recipients. In general, one finds that states with higher benefits are more likely to make deeper cuts. States also cut their welfare benefits when poverty rates are both relatively high and climbing .
INTENSIFYING THE RACE TO THE BOTTOM
If the House bill becomes law, the race to the bottom is almost certain to intensify. Some states will undoubtedly tighten eligibility standards and reduce benefit levels, and by so doing, reduce their share of welfare costs. If this happens, high-benefit states will become more powerful welfare magnets than ever before. Poor people in low-benefit states will consider the costs and benefits of moving to a magnet state. Some will undoubtedly decide to move, or to remain in a magnet state when they might otherwise have made a move.
Under the terms of the proposed legislation, the cost of becoming a welfare magnet will be much greater than at present. Unlike current federal welfare grants, the block grant is a fixed sum of money that does not change with the number of individuals in the state eligible for assistance. If poor people move to states with more generous benefits, those states will experience an increase in their welfare burden without any commensurate increase in federal funding. To safeguard against rapidly rising state welfare costs, the generous states will come under increasing fiscal and political pressure to reduce their benefits. Eventually, all states will be racing to shift the cost of welfare to their neighbors.
In the past, the pressure on states to cut benefits has been mitigated by the fact that increases in the cost of welfare have been shared more or less equally between states and the national government. Under the proposed legislation, new welfare costs will be borne entirely by the states. Thus, the states can be expected to react quickly to any sign they are becoming welfare magnets.
Influential members of Congress also have proposed decentralizing control over food stamps. Should such a proposal become law, variation in state policy will increase and the race to the bottom can be expected to accelerate. Until now, interstate variation in the combined cash and food stamp benefit has been moderated by the design of the Food Stamp Program, which increases by one dollar whenever cash benefits are cut by three. This provision reduces by about one-half the extent of interstate differences in combined cash and food stamp benefits. Turning the Food Stamp Program into a block grant will eliminate this important equalizing aspect of current national policy.
Should Medicaid also be incorporated into a block grant program, the problem would become even more serious. Most medical services paid for by Medicaid are mandated by federal regulations. State variation in Medicaid policy is limited largely to coverage of some optional services and the amount paid to providers for services.
Poor people in need of costly medical services have especially large incentives to locate in places where medical benefits are more generous. As the more generous states experience a rise in their low-income, medically needy populations, they will come under increasing pressure to match cuts that have occurred elsewhere. The race to the bottom could become quite deadly.
THE NEED FOR NATIONAL STANDARDS
Congress can mitigate the race to the bottom in any block grant it enacts by tying federal grants to the size of the eligible population and by setting minimum-eligibility and benefit-level standards for health care, nutrition, and cash benefits. In a society in which both people and businesses are highly mobile, it makes little sense to leave the marginal cost of welfare provision to lower tiers of government.
Chapter 3
Rainy Day Funds: Contingency Funding for Welfare Block Grants
by Wayne Vroman
The House-passed welfare reform bill (H.R.4) proposes to convert the present funding of Aid to Families with Dependent Children (AFDC) and other welfare programs to block grants. Each state would receive a federal allocation fixed in advance. The block grant approach to welfare has been criticized as being unresponsive to changes in economic circumstances. During an economic downturn, for example, welfare caseloads grow. A fixed federal allocation would present states experiencing such downturns with three unpleasant alternatives: reducing support levels, restricting eligibility, or adding supplemental funding out of state funds. But the House bill would also establish special “rainy day” funds to help meet such unanticipated or emergency funding needs.
WHAT ARE RAINY DAY FUNDS?
The Federal Rainy Day Fund would be established with a $1 billion appropriation in FY 1996. States could borrow from the fund for up to three years at the market interest rate for federal debt of the same maturity. The maximum permissible amount would be either $100 million or half the state’s block grant for that fiscal year, whichever is smaller. To be eligible to borrow, a state must have a high and rising unemployment rate. Specifically, its unemployment rate must average at least 6.5 percent for three consecutive months and be at least 10 percent higher than the rate during the same three-month period in at least one of the previous two years.
A second, state-level rainy day fund is also authorized in the bill. States may use unexpended block grant monies in an unrestricted manner if they accumulate balances of sufficient size. Since the basic block grants will be smaller than present federal funding of AFDC, it seems unlikely states will be able to accumulate balances large enough to allow such unrestricted use. Nevertheless, this provision provides states with a financial incentive to cut AFDC payments.
HOW BIG A FUND IS NEEDED?
The appropriate size of a federal emergency or rainy day fund depends on its purpose. If the fund is intended primarily to alleviate the costs of caseload growth arising from increases in the unemployment rate, the fund does not have to be as large as if it were to serve a broader purpose.
To Compensate for Increases in Unemployment. Single-parent AFDC caseloads are not very sensitive to economic cycles. The AFDC-Unemployed Parent (AFDC-UP) caseloads are, naturally, much more sensitive to unemployment, but the AFDC-UP program accounts for only 6 to 8 percent of the total AFDC caseload. A one percentage point increase in the employment gap (the percent by which actual employment falls below full employment) raises basic AFDC caseloads by about 60,000 and AFDC-UP caseloads by 19,000. The implied peak-to-trough increases in caseloads during the 1989-1992 period were about 300,000 for basic AFDC and 95,000 for AFDC-UP. These increases represent about 8 percent and 50 percent, respectively, of the 1989 caseload levels. The combined increase of 395,000 caseloads for basic AFDC and AFDC-UP represents 10.5 percent of the total 1989 AFDC program.
Even if the cyclical caseload growth were double these estimates, such growth is still small relative to the experiences of the regular Unemployment Insurance (UI) program, which provides compensation for up to 26 weeks of unemployment. Between 1973 and 1975, the total number of weeks of compensation paid in the regular UI program increased by 144 percent – from 71 million to 173 million weeks. During the most recent downturn, which was less severe than that of 1973-1975, the total number of UI weeks of compensation rose by 53 percent – from 98 million weeks in 1989 to 150 million in 1992.
Combined state and federal payments for AFDC currently total about $25 billion annually. Thus, a rainy day fund that equaled 20 percent of current annual outlays would amount to $5 billion, about five times the size of the fund proposed in H.R.4.
To Compensate for Demographic or Other Change. The largest single factor affecting AFDC caseload growth is demographic change: changes in population, in the number of families headed by women, and especially in the number of families headed by never-married women. If the goal of the rainy day fund is to protect against contingencies that are broader than one year of recession-induced unemployment—such as demographic change, tightened eligibility for related safety net programs, or a recession with effects that extend beyond the one-year borrowing window – an even larger fund would be needed.
H.R.4 includes a provision for population growth to effect an increase in a state’s basic block grant during fiscal years 1997-2000. However, the total amount specified for population growth is only $100 million. If AFDC spending were to grow in line with the kind of population growth the U.S. has experienced during recent years, it would need to increase by about 5 percent over the next five years. Instead, the $100 million included in H.R.4 equals about 0.7 percent of federal AFDC outlays.
States with large population increases would also be disproportionately affected. For example, if California accounted for one-quarter of national population growth, its basic block grant would increase by $25 million, which is only 0.5 percent of its current (federal plus state) AFDC outlays. Also, there is no explicit provision in H.R.4 for growth in the number of female-headed families, a segment which grew by 2.3 percent annually between 1987 and 1991.
Another disproportionate constraint on fund use by large states is the absolute loan cap, also set at $100 million. At present, annual AFDC spending totals about $5 billion in California, $2.5 billion in New York, and between $0.8 billion and $1.3 billion in the six next largest states. Thus the $100 million loan cap represents 2 percent, 4 percent, and 8 to 12 percent, respectively, of current annual outlays for these states. Put another way, the cap amounts to less than 20 percent of the annual AFDC spending for all the 10 states with the largest AFDC outlays. But since these 10 states account for 60 percent of total AFDC spending, the loan cap disproportionately works to the disadvantage of the large states.
ISSUES IN FUND MANAGEMENT
At least three questions are pertinent to fund management.
- What should be the withdrawal criteria? If increased unemployment were the only withdrawal criterion it would be easy to review, approve, and determine loan amounts. The current eligibility criteria for H.R.4 are simple; the only problem is the possibility of false signals from unemployment rates in very small states. States would undoubtedly like to add additional criteria to recognize special circumstances, but these would complicate the approval of financial assistance.
- Should withdrawals be treated as loans or grants? If funds were disbursed as grants there would be no need for the states to repay them. Grants are the more expensive route for the federal budget. But a strong case can be made for grants, since states should not be held responsible for caseload growth caused by fluctuations in the economy.
One effect of treating disbursements as loans would be that states might restrict eligibility for benefits to prevent and/or reduce their future borrowing. This was the experience of debtor state UI programs in the mid-1980s. As debtor states faced the prospect of large debt repayment costs, they enacted solvency legislation that restricted benefit availability (and raised employer UI payroll taxes). - Should the risks be pooled? A federal rainy day fund has one clear advantage over the current set of state UI trust funds—the pooling of risk. The UI programs have individual state trust funds. Since UI borrowing patterns in each recession are highly concentrated by geographic area, a system of separate funds requires the aggregate of state UI trust fund balances to be larger than what would be needed by a single national fund. With just a single nationwide AFDC fund, state-level unemployment-related risks would be pooled, and the aggregate fund would need to be only large enough for use by states with unemployment levels higher than the threshold.
HOW WOULD THE FUND INITIALLY ACQUIRE ASSETS?
The $1 billion trust fund proposed in H.R.4 would not be difficult to fund fully. But funding a new federal trust fund on a scale commensurate with the potential need – $5 billion for one-year countercyclical goals, considerably more for broader contingencies – will not be easy, particularly if it is to be accomplished within a single year. This suggests the wisdom of considering a phase-in period. The risk of a phase-in, of course, is that the next recession will start before the fund is fully built up.
The initial experiences of the UI trust funds are instructive in this respect. The UI payroll taxes were first levied in 1937. Benefits were paid beginning in 1938. From 1938 to 1945, UI taxes exceeded benefit payouts by wide margins in every year, both because the program proved less expensive than originally anticipated and because of the strong labor markets created by World War II. At the end of 1945, for example, the aggregate trust fund balance of $6.9 billion represented about seven years of benefit payouts at prevailing payout rates. The current fiscal environment would be extremely hostile, however, to such a steady and substantial initial accumulation in an AFDC rainy day fund.
DOES THERE NEED TO BE AN EXPLICIT TRUST FUND?
An alternative strategy for providing back-up to the states would be to create a federal loan authority from which eligible states could borrow during emergency periods. One advantage of this approach is that monies would not have to be set aside during the initial years of the new AFDC financing arrangement to stock the rainy day fund.
Recent experiences with the Emergency Unemployment Compensation (EUC) program suggest, however, that Congress is reluctant to use emergency financing (allowed under existing budget rules) even for a program as popular as jobless benefits. Four of the five phases of EUC were “financed” or fully offset, despite the program’s title and its recession-related origin. Even if AFDC emergency loans had to be financed, of course, the short-run advantage would be not having to prefund the rainy day fund as proposed in H.R.4.
A CAVEAT FROM THE UI EXPERIENCE
The UI experience makes it absolutely clear that states are extremely responsive to the financing provisions of contingency funds. Before 1982, states were not charged interest for withdrawals from the federal UI loan fund. They repaid much more promptly when interest payments were assessed starting in that year. In 1983, states with UI debts were extended easier repayment terms if they restricted UI eligibility. Eligibility restrictions quickly followed. If states become responsible for cyclical AFDC costs, they are almost certain to enact benefit restrictions during economic downturns. This timing is inappropriate in both macroeconomic and human terms, but state-level fiscal considerations could easily override other priorities.
Chapter 4
Increasing the Employment and Earnings of Welfare Recipients
by Robert Lerman
Over the last three decades, political leaders and policymakers have relied on a combination of three tools to increase the employment and earnings of welfare recipients: financial incentives; job search and work requirements; and training and education. The evidence indicates that all three strategies can increase work effort. But programs that emphasize job search and work are more cost-effective than programs that rely primarily on financial incentives or training and education. By themselves, such measures are unlikely to have a major impact on poverty and welfare dependency. But as part of a more comprehensive package that includes child support, earned income tax credits, and health insurance, they could substantially improve the lives of those now on welfare.
WORK INCENTIVES
The current welfare system contains major disincentives to work. If a mother and child on Aid to Families with Dependent Children (AFDC) have no income of their own, they may qualify for an average of $500 a month in cash benefits. If that mother takes a part-time job, say at $300 a month, her family becomes “less needy” and her welfare check is reduced (to offset the increase in her income). The higher the benefit reduction rate (equivalent to a tax on earnings), the weaker the incentive to work. This incentive is further weakened because other earnings benefits (notably food stamps, housing assistance, and Medicaid) are also reduced as earnings increase . The policy problem is that lowering the benefit reduction rate necessarily raises the income cutoff for eligibility, increases the proportion of benefits going to the less needy, and increases the number of recipients and thus welfare expenditures.
For example, a state providing an income floor of $500 that reduced its benefit reduction rate from 100 percent (no net increase in income from earnings) to 50 percent would suddenly find its eligibility cutoff point increasing from $500 to $1,000.
The federal government began mandating states to provide some financial incentive for mothers to work in the late 1960s. During the 1970s, AFDC benefit reduction rates declined and some earnings that went to pay work expenses did not count against benefits. In 1981, however, Congress again increased the work disincentives built into AFDC and limited any earnings exclusions to the first four months on welfare.
The Clinton Administration philosophy is to “make work pay” by expanding non-welfare benefits for recipients willing to work. In 1994, Congress passed an extremely large expansion of the Earned Income Tax Credit (EITC) to improve the work incentives of all families with children, including families on welfare. By 1996, for families with two or more children, the EITC will pay 40 percent of earnings up to $8,900 per year, or a maximum of $3,560. The EITC will begin to phase out as families earn more than $11,620 per year, with each $100 of added earnings lowering the EITC payment by $21. Outlays on EITC will reach $25 billion in 1996.
Expanding health insurance, child care, and child support are three other components of the strategy of making work pay outside the welfare system. At the same time, some states are experimenting with provisions that disregard increasing amounts of an AFDC recipient’s earnings and thus lower the rate of benefit reduction within the AFDC program.
The Child Assistance Program (CAP) experiment in three New York counties provides new evidence that AFDC recipients respond to work incentives . CAP experimented with a benefit formula that combined a basic benefit lower than AFDC with a significantly more generous treatment of earnings (up to the poverty line, $1 of added earnings reduced the CAP grant by only 10 cents, a 10 percent benefit reduction rate). AFDC recipients were randomly assigned to a treatment group with access to CAP or to a control group. To qualify for the CAP rate, mothers had to have a support order for each child. During the second year of the experiment, the CAP treatment group earned 30 percent more per month than the control group. Among those initially not working, the earnings advantage of the treatment group over the control group reached 40 percent, for an average earnings gain of about $50 per month . Although the CAP results are encouraging, it should be noted that the program combines a lower benefit reduction rate with a lower basic benefit. It would be a mistake to conclude that lowering the benefit reduction rate by itself will necessarily lead to more employment. While those already on welfare will almost certainly work more, those made newly eligible by a higher eligibility cutoff point are likely to work less. On balance, the net effect is uncertain and may not be positive . Thus, the introduction of work incentives in the late 1960s and their virtual elimination in the early 1980s had less impact on employment than many people expected.
One factor that discourages many welfare recipients from working is their fear of losing health insurance coverage. According to one study, making generous health insurance benefits available to all female workers would raise the employment rate of all heads of families 16 percentage points and reduce AFDC caseloads by 20 to 25 percent .
In sum, although welfare recipients face high penalties on added earnings that discourage work, eliminating such disincentives extends eligibility for welfare to a larger population, reduces the work effort of people who join the rolls because of the increased income eligibility cutoff, and may not be cost effective for these reasons.
WORK REGISTRATION, JOB SEARCH, AND WORKFARE
A second strategy to increase employment is to require AFDC recipients to work or register for work and training. In 1981, amendments to the Omnibus Budget Reconciliation Act allowed states to use workfare. Workfare requires recipients to work in unpaid jobs in return for their welfare benefits. States responded by expanding job-search and workfare activities and making the activities mandatory. A common program began by assisting recipients with a job search in the private sector, but required unpaid work in the public sector for those unable to find private jobs.
Research using treatment-control experimental designs yielded a robust array of findings about the impacts of workfare. For a modest investment of government funds, nearly all the state and local programs evaluated have increased the earnings of recipients and reduced welfare payments . In many cases, the decline in welfare payments over a three- to five-year period more than offset spending by the government. For example, total AFDC payments over five years declined by 10 percent in San Diego, California, and by 14 percent in Arkansas. Most of the gain in earnings occurred because recipients subject to the mandates found jobs more quickly than their control group counterparts. However, the effects on earnings generally continued for four to five years, as a somewhat higher share of treatment group recipients decided to remain in low-wage jobs rather than leave employment completely.
The largest impacts took place in Riverside, California, where local program officials successfully imbued staff with an ethic that emphasized immediate entry into private-sector jobs . Case managers were subject to job placement standards and the program made great effort to persuade local employers to hire recipients. Over three years, Riverside recipients subject to the experimental treatment earned an astounding 40 to 50 percent more than recipients in the control group. Earnings gains averaged about $1,000 per year and showed no tendency to decline over time. This accomplishment is particularly impressive given the modest added costs of the Riverside intervention (about $1,600 per recipient subject to treatment) nearly all of which went for orientation, job search, and basic education. San Diego, which used a similar strategy, obtained similar results .
It is unclear whether other cities will be able to replicate the substantial earnings gains among welfare recipients that were achieved in these two California cities. However, the best evidence suggests that where cities or counties are willing to implement rigorous programs emphasizing job search and enforcing work requirements, about 5 to 8 percent more recipients will be working and the average earnings of welfare recipients will rise by $500 to $1,000 a year, often enough to pay for the added administrative and service costs.
TRAINING AND EDUCATION PROGRAMS
Programs allocating substantial funds to education, training, and support services generally do no better and sometimes do worse than those that focus primarily on immediate job placement. For example, despite much higher outlays for education, training, and services in Alameda County, California, than in the San Diego and Riverside programs mentioned earlier, earnings gains for recipients were lower. Emphasizing training has achieved rising earnings over time in some places, but not enough to offset higher costs and lower effects in the early years. Moreover, linking training to welfare benefits carries the potential long-run drawback of creating an incentive to go on welfare just to gain access to training.
CAN WORK-ORIENTED INTERVENTIONS REDUCE POVERTY?
The evidence clearly shows that welfare system changes can raise the earnings of recipients. Both incentives and work requirements matter, but neither is a panacea for moving families off welfare and out of poverty. In Riverside, the most successful program evaluated to date, the proportion of families escaping from poverty rose by about 4 percentage points, from 15.7 percent to 19.4 percent. Earnings averaged about $3,600 a year for all members of the treatment group (including nonworkers) and about $8,000 a year for the 44.5 percent who worked in the third year.
Viewed in the context of a more comprehensive approach to reducing welfare dependency and poverty, however, work programs can play an important role. Welfare dependency and poverty would decline substantially, for example, if families now on welfare could combine annual earnings of about $8,000 per year with $2,500 to $3,000 in child support, $3,000 in EITC, and non-welfare-related access to health insurance. These gains would not be enough to offset the increased economic hardship associated with the rising incidence of one-parent families, but they would substantially improve the lives of large numbers of American children.
Chapter 5
An Administrative Approach to Welfare Reform
by Lawrence M. Mead
Is the best way to reform welfare to restructure it from the top, or to improve administration at the bottom? The two major proposals now on the table—the Clinton Administration’s Work and Responsibility Act and the Personal Responsibility Act passed by House Republicans—emphasize restructuring.
Both proposals seek to limit government’s commitments to the needy, in the view that this is the best way to discourage unwed pregnancy and nonemployment by poor adults – the chief conditions that precipitate dependency. But both proposals conflict with public desires about reform, which are to require work of employable welfare-receiving adults while continuing support for the needy.
The Clinton plan maintains support levels but exempts much of the caseload from work requirements in order to limit costs. The Republican bill includes tough work standards but provides no specific funding for work programs, and would allow families to be denied aid whether or not they could work.
REFORM AS ADMINISTRATION
A more promising approach may be to intensify the administrative style of reform that dominated welfare policy from the late 1960s through the Family Support Act (FSA) of 1988. This approach to welfare reform sought to rectify abuses and enforce work requirements while receiving welfare, without curbing eligibility or challenging the principle of aid. As a condition of federal welfare funding, states have had to:
- Increase quality control, i.e., minimize errors in benefit payments in AFDC and other programs;
- Improve collection of child support; and
- Require employable recipients to enter work programs designed to place them in jobs or training.
All of these measures involve enforcement – demands that recipients comply with certain rules as a condition of aid.
Quality control sharply reduced the incidence of errors in AFDC, from 17 percent in 1973 to 6 percent in 1990. The potential for further savings there appears small. Child support is far less fully enforced. Only 11 percent of AFDC costs are now defrayed out of support collections. But even optimal child support enforcement would probably reduce the AFDC rolls only 9 percent, simply because the fathers of welfare families typically have very low earnings.
THE POTENTIAL OF WORK REQUIREMENTS
Work requirements within welfare show more potential. Only 6 percent of AFDC mothers report working at a given time. Probably a third actually work, with much of the earnings unreported to welfare offices, but this level is still well below that found among nonpoor single mothers, over half of whom work full-year and full-time. The best estimates are that two-thirds to four-fifths of welfare mothers potentially could work. If they did so “on the books,” between one-third and four-fifths of them would leave AFDC and food stamps, the extent depending mainly on whether they worked full-time or part-time and also on their child support income and child care costs.
The Job Opportunities and Basic Skills (JOBS) program, the employment program now linked to AFDC, is a long way from enforcing work on that level. In 1995, JOBS rules require that states have 20 percent of employable recipients active in the program on a monthly basis. By 1993, the average state had obtained an activity level of 23 percent. In California, the program raised the earnings of clients an average of 22 percent over three years, leading to a 6 percent drop in welfare payments. In Riverside County, which had the strongest results, the comparable figures were 49 and 15 percent. Such limited effects on the rolls cause many analysts to conclude that the potential of work requirements, too, is limited.
However, these results may understate the potential of a determined work program to increase activity while recipients are receiving welfare assistance and to reduce such assistance over time. In the 1980s, work programs that preceded JOBS at least doubled the share of recipients engaged either in work, looking for work, or training, compared to control. And though the nation suffered a sizable rise in welfare program participation in recent years, states that implemented JOBS forcefully recorded a smaller increase, even controlling for other influences.
THE WISCONSIN EXAMPLE
The potential of an administrative approach to reform is best shown in Wisconsin. The state has cut its caseload 23 percent since 1987. While some of the fall was due to a 6 percent benefit cut in 1987 and a favorable economy compared to the rest of the country, the state cut its caseload by 3 percent even during 1989-1993, a period when the country as a whole saw a 29 percent increase. Wisconsin achieved this despite paying the twelfth-highest welfare benefits in the nation. Only two other states recorded any reduction: Louisiana and Mississippi.
A major factor appears to be an effective JOBS program. Wisconsin ranks well above average in JOBS participation, and has recently promoted an emphasis on immediate employment (as opposed to education and training), one of the reasons for Riverside County’s success. The most effective Wisconsin county programs insist that clients participate and take available jobs, and they invoke these requirements as soon as recipients enter the welfare system.
In Kenosha, the most notable case, 88 percent of the caseload is enrolled in JOBS in a typical month, and 40 percent of clients are already working while still on welfare. The employment figure is so high, in part, because the program emphasizes part-time work along with remediation. Kenosha stresses work but encourages clients to pursue training for better positions once they are employed. As a result, it achieves both high numbers of job entries and high job quality (e.g., high wages and job retention).
The effective work programs combine assistance with clear expectations of reciprocal responsibility on the part of the clients. These programs induct all employable recipients into the program, then quickly assign them to job search or, if necessary, remediation. Above all, case managers follow up on clients to make sure they fulfill their assignments. Staff also pursue dropouts to return them to the program. A work message is conveyed strongly but usually informally. Kenosha makes heavy use of “reconciliation” proceedings, for example, minimizing sanctioning of clients (financial penalties) for non-cooperation.
WHAT IT TAKES TO REFORM WELFARE
Wisconsin achieves the sort of welfare reform the public wants – more work and less dependency while maintaining aid to the needy. But this administrative style of reform makes severe demands on government. It requires strong political leadership, skilled administrative direction, hard-working staffs, and efficient reporting systems. Successful managers must set high expectations for their staffs, as well as clients, and must hold accountable for performance the agencies to which they subcontract for services. Exceptional work programs require years of development.
Wisconsin can meet those demands because the state has all of the following:
- An innovative governor willing to make welfare reform his major issue. The Tommy G. Thompson administration has launched several reform initiatives of its own.
- Initiative for reform at multiple levels aside from the governor’s office, including a number of counties and business groups.
- High-quality, well-funded bureaucracy at the state and county levels.
- A bipartisan, progovernment political culture in which, more than in most states, liberals support enforcing work in welfare and conservatives support an ambitious social policy.
THE FEDERAL ROLE
Whereas the restructuring approach to reform gives priority to policy changes made in Washington, the administrative approach makes the local level primary, for it is only there that effective programs combining aid with behavioral requirements can be realized. The role for federal policymakers then changes. They must see themselves less as leading change and more as creating incentives for effective program development lower down in the intergovernmental system. They must also think in terms not only of resource distribution but also of building the type of institutions that have helped make Wisconsin’s welfare reform effort so successful. Thinking in these structural terms is alien to the thought ways of Washington.
The difficulty is that few state and local governments have institutions as strong as those of Wisconsin (or Kenosha). Most deliver public services adequately, but they lack the greater political consensus and administrative capacity required to reform the welfare system from within. Fortunately, federal policies can promote change. Federal requirements drove the sharp lowering of error rates in grant payment, just as they now, at a slower pace, are toughening child support enforcement. The participation mandates set for JOBS in the Family Support Act already have forced big-city welfare departments, such as New York’s, to get serious about work for the first time.
Rather than cut or time-limit welfare, Congress should update the mandates that have prompted work enforcement to date. At a minimum, it should extend the 20 percent JOBS participation standard in effect for 1995, which is due to expire at the end of the current fiscal year. Congress might also:
- Raise the JOBS participation floor to 50 percent, to be implemented over several years. Both the Clinton and Republican plans would do this, although the latter measures participation more stringently.
- Set some standard for the share of JOBS participants who must be working or looking for work, the level to vary directly with the share of state population on welfare. The higher the latter proportion, the higher the share of recipients likely to be employable.
- Set more specific performance measures for JOBS, for example for the number and quality of job entries achieved. Such measures were called for by the FSA in 1988, but the Clinton Administration has yet to make specific recommendations.
All of these measures would be connected in some way to federal funding, so that states would face strong financial incentives to improve the reach and quality of their programs. Exactly how they would do this would be left to them. The standards would force local authorities to give ongoing attention to the work mission, and over time the administrative capacity of welfare would rise.
Chapter 6
Child Care Block Grants and Welfare Reform
By Sandra Clark and Sharon Long
Recently introduced legislation would significantly alter the current system of child care assistance for low-income families. Proposed changes would consolidate the major sources of federal assistance into a single block grant to states and reduce federal funding by 9 percent over the next five years. They would also reduce cash assistance to families, thereby increasing the number of parents needing to work. Thus, welfare reform will increase the need for affordable child care at the same time as the block grant mechanism is likely to reduce available child care subsidies.
CURRENT FEDERAL CHILD CARE
Federal involvement in the child care market has been justified as a means of offsetting the cost of children, as a work incentive for low-income parents, and as an investment in the education and development of children. On these grounds, the federal government provides substantial support for child care through tax credits, direct subsidies, and supportive services.
Of the more than 20 different sources of federal support for child care, the single largest source is the nonrefundable Dependent Care Tax Credit, which offsets 20 to 30 percent of a working parent’s child care expenses (up to a maximum) via the tax system, at a federal cost of $2.5 billion in 1993. Most of the 6 million families receiving this credit are middle – and upper-income, since the credit is not available to families too poor to pay taxes. One-third of working families with incomes greater than $25,000 a year claimed the tax credit in 1988, compared to 12 percent of working families with incomes below the poverty line.
Of greater relevance to low-income families are the four major federal direct-subsidy programs that are the focus of the block grant legislation: Aid to Families with Dependent Children (AFDC) Child Care, Transitional Child Care, At-Risk Child Care, and the Child Care and Development Block Grant (CCDBG). In FY 1993, the federal government provided $1.74 billion in funding for these four programs combined (see Figure 1).
The AFDC and Transitional Child Care programs provide child care entitlements to families who currently receive AFDC and are working or in job training programs, and families who have lost eligibility for AFDC within the last 12 months due to employment. The At-Risk Child Care program serves low-income working families who would be at risk of becoming eligible for AFDC if they did not receive child care assistance. The CCDBG, which accounts for about half the total federal spending that would be affected by the block grant, serves the broad, low-income working population. Neither the At-Risk nor the CCDBG program guarantees child care to individual families. The AFDC, Transitional, and At-Risk programs all require state matching funds; the CCDBG does not have a match requirement. Some CCDBG funds are used to provide assistance to AFDC families, thereby reducing the funds available to the non-AFDC working poor.
Program eligibility rules and provider reimbursement rates vary widely across the states, and in some cases across programs within a state. The current system often is criticized as unnecessarily fragmented because of multiple funding streams and program rules. Even in states that have effectively created child care systems that are “seamless” to the families served, the system is complex and difficult to administer.
HEAD START
While not traditionally viewed as a child care program, Head Start provides out-of-home services to a large number of low-income children. In FY 1993, Head Start received nearly $2.8 billion in federal funding and served about 714,000 low-income children.
Because Head Start was designed as a child development rather than a child care program, it has not, in general, met the child care needs of low-income working families. Historically, Head Start has served primarily 3- to 5-year-olds in part-day programs, making it an unsuitable option for low-income parents working a full day or for younger siblings of program participants. In recent years, efforts have been made to increase the number of Head Start programs offering full-day services and to expand Head Start services to children ages three and under.
DISPARITIES AMONG ELIGIBLE GROUPS
Among the various low-income groups eligible for At-Risk and CCDBG funds, state-established funding priorities often target families with special needs (e.g., teen parents, child protective services clients), leaving limited funds available to the broader low-income working population. As a result, many eligible families go unserved and programs maintain long waiting lists for child care assistance. Statewide estimates of 40,000 (Texas) to 225,000 (California) children waiting for subsidies have been reported by the General Accounting Office. In San Francisco, a low-income working mother can wait up to two years to receive a subsidy for a toddler and one year for an infant. Often a family’s economic situation changes or a child “ages” out of a program while the family is waiting for assistance.
Thirty percent of working poor families, compared to between 36 and 37 percent of nonworking poor and nonpoor families, receive child care assistance from direct subsidies (including Head Start) or through the tax system (see Figure 2). The working poor are less likely than the nonworking poor to qualify for and receive child care subsidies and less likely than higher-income families to file a tax return and receive the tax credit.
THE PROPOSED CHILD CARE BLOCK GRANT
The Personal Responsibility Act (H.R.4) would establish a single child care block grant that consolidates the CCDBG, AFDC, Transitional, and At-Risk programs, as well as several smaller child care programs. The Dependent and Child Care Tax Credit and Head Start would be unaffected. Funding for the new child care block grant would be capped at $2.1 billion a year—$150 million above the FY 1994 federal funding level for the four major child care subsidy programs to be included. The Congressional Budget Office estimates that this change would reduce federal funding by $1 billion over the FY 1996-2000 period, a 9 percent reduction from current federal spending on the four major programs involved.
Under the block grant proposal, states would no longer be required to match federal funds. The impact of the block grants on child care funding levels is likely to vary widely across the states. But the overall reduction in child care spending is likely to be higher than the federal reduction alone, because states will have an incentive to reduce or eliminate what they now spend in matching funds for child care. When federal funding for social services (including child care) was reduced in the early 1980s, states did not, in general, provide added funds for child care services. Instead, state funds were used to maintain crisis-oriented social services.
IMPLICATIONS OF THE PROPOSED BLOCK GRANT
H.R.4 would grant states increased flexibility to target and administer child care subsidy dollars. This change could reduce the complexity of the current system by eliminating the multiple funding streams and program rules. However, a block grant would also eliminate all entitlements to child care assistance, leaving the total number of families served subject to the available funds. As more families participate in education and training activities and enter the work force in response to welfare reform measures, there is likely to be an increase in the number of children needing child care.
In addition, child care subsidy programs tend to encourage work. A number of studies report significant increases in mothers’ employment or labor force participation associated with lower child care costs. Several recent studies provide evidence that the effects are stronger for low-income families. One such study estimates that providing a full subsidy for poor mothers would increase their labor force participation from 29 to 44 percent, compared to an increase of 43 to 57 percent for near-poor mothers, and 55 to 65 percent for nonpoor mothers.
Reduced child care funding is likely to lead a large number of families to rely on relatives or friends for informal child care. But this is not an option for all families – as relatives and friends may not live nearby or may be in the labor force themselves – and may be inadequate for others. Parents using informal arrangements report a greater incidence of losing time from work or being prevented from working because of child care problems than those using formal arrangements.
Also, informal care is not always provided free of charge. About 36 percent of employed mothers using relatives for care pay for that care. Overall, 27 percent of working poor families pay for care, with child care costs taking 33 percent of the family budget on average. This compares to 13 percent of the budget of nonpoor families with incomes less than $25,000 a year, and 6 percent for families with incomes of $25,000 a year or more. Child care ranks as the single largest expense after housing, food, and taxes for working parents.
Strapped family budgets limit the funds available to pay for child care and constrain the quality of child care that can be purchased. A significant percentage of day care centers and family child care homes have been reported to provide care that impedes the emotional and intellectual growth of children. Such problems could be exacerbated by the proposed funding reductions.
CONCLUSION
The goal of H.R.4 and similar proposals is to move low-income families into the work force. Child care block grants may undermine efforts to achieve this goal by limiting low-income families’ ability to obtain stable, dependable child care.
One of the objectives of block granting and capping programs like subsidized child care is to reduce the budget deficit. Deficit reduction is a worthy goal. But reducing child care subsidies for low-income working families – while maintaining the Dependent Care Tax Credit (used primarily by higher-income families) – concentrates the burden of deficit reduction on those least able to pay.
Figure 1

Figure 2

Chapter 7
Who is Affected by Time Limits?
By LaDonna Pavetti
The Personal Responsibility Act (H.R.4), known as the PRA, passed by the House of Representatives includes a five-year limit on the receipt of cash welfare benefits. This provision would prohibit states from using federal funds to provide cash assistance to families who have received cash assistance for 60 months or longer. In cases of extreme hardship, states would be permitted to exempt up to 10 percent of their caseloads from this restriction. The PRA does not require states to provide benefits for any minimum period of time. Thus, the proposal allows states to provide cash assistance to families for fewer than five years.
WHY TIME-LIMIT AFDC BENEFITS?
Policies to time-limit AFDC benefits have been important components of the vast majority of welfare reform proposals developed over the past year. Time limits were initially proposed as part of a comprehensive set of welfare reform policies designed to increase the economic return to recipients from working, especially in low-wage jobs, and to increase the flow of income to children through better child support enforcement. Central to this strategy was a plan to convert welfare into a transitional system designed to provide short-term financial, educational, and social support for families in need of such assistance and minimum-wage jobs for families who exhausted their transitional support. The time limit included in the Work and Responsibility Act of 1994, President Clinton’s welfare reform plan, was modeled after this approach. Under the Clinton plan, AFDC recipients would have been eligible for cash assistance not conditioned on work for up to 24 months. After 24 months, families receiving assistance who were able to work but unable to find unsubsidized employment would have been eligible to continue receiving cash assistance as long as they were willing to work in exchange for that assistance.
The time limit in the PRA departs dramatically from this conception of time limits. First, the time limit is not linked to any increased efforts to help recipients find and keep unsubsidized employment. Second, the PRA provides no safety net for families who are willing to work but are unable to find unsubsidized jobs.
HOW MANY FAMILIES WOULD BE AFFECTED BY POLICIES TO TIME-LIMIT AFDC?
It is extremely common for AFDC recipients to leave the welfare rolls shortly after their initial receipt of welfare assistance. However, it is equally common for many of those who do leave to return almost as rapidly as they left. Even when this movement on and off the rolls is accounted for, the majority of families who ever receive AFDC benefits receive them for relatively short periods of time. Still, over their lifetimes, a substantial minority of families do end up receiving AFDC for extended periods of time. In addition, because these longer-term recipients accumulate on the welfare rolls as time passes, they end up accounting for a large fraction of recipients on the welfare rolls at any given point in time. Thus, a substantial number of families eventually would be affected by policies to time-limit AFDC benefits.
The data presented in Figure 1 illustrate these points. The second column shows a distribution of total time on welfare (over a lifetime) for new entrants (families just beginning a spell of welfare receipt who have never been on the rolls before). The last column shows a distribution of total time (also over a lifetime) for all recipients currently on the welfare rolls. These two distributions provide very different “pictures” of the caseload. Of all families that become dependent on welfare assistance, about 42 percent receive benefits for less than 24 months. But at any point in time, there are many more long-term recipients. For example, more than 75 percent of families on welfare at any point in time will receive welfare for more than 60 months.
Which of these two distributions is most relevant? The answer is that it depends on the policy being proposed. Legislation might conceivably specify that time limits be applied to the entire existing caseload, say by giving everyone five (more) years of eligibility as of a particular date. Or time limits might be applied just to new entrants who enroll in welfare after a particular date.
If the five-year time limit is applied to the entire existing caseload starting in 1996, no family would reach the time limit until at least 2001. At that point, 1.42 million families would be affected (see Figure 2). Most of them (1.34 million) were already on the rolls in 1996 but some (0.08 million) are new entrants. By 2002 the number who would reach the time limit increases to 1.65 million families (including 1.41 million who were on the rolls in 1996), and so on. Thus, over time, new entrants would begin to account for an increasing share of the AFDC caseload and families from the 1996 rolls would account for a declining proportion of the total number reaching the time limit. If only new entrants are subject to the five-year time limit, the number of families that reach it would be dramatically lower, especially in the early years of implementation (e.g. 80,000 in 2001).
EMPLOYABILITY DIFFERENCES WITHIN THE CASELOAD
The new entrant population is quite different from the population of all families on welfare, suggesting that state and local governments would have to design very different programs depending on which strategy is chosen. New entrants are likely to be younger, to have preschool-age children, and to include many who will find jobs or leave welfare without much assistance. In contrast, recipients currently on the caseload tend to be older and to have older children. Many already have received welfare for extended periods of time, and they tend to have less education and more health and other problems than new entrants. Recognizing that it would be difficult—and costly—for states to prepare successfully for permanent self-supporting employment of both young mothers just beginning their welfare receipt and older, long-term recipients, the Clinton plan only subjected recipients who were born after 1971 to a time limit (of two years rather than five).
The employability of those who would reach a five-year time limit does not look especially promising. Half of those who spend longer than five years on the welfare rolls enter AFDC with no labor market experience and 63 percent have less than a high school education (see Figure 3). Also, 42 percent first received welfare when they were under age 25, the time when the vast majority of workers make investments in education and gain experience in the labor market that prepares them for stable future employment.
EXPERIMENTS, NOT DRASTIC CHANGES, NEEDED
Undoubtedly some families faced with a time limit will find unsubsidized employment or some alternative means of support sooner than they might have without a time limit. However, the characteristics of long-term recipients shown in the table below make it extremely likely that some families will not be able to find an alternative means of support. Although we can estimate approximately how many people would be affected by the time limit proposed in H.R.4, and we know something about their characteristics, we have no way of assessing how they would fare once their welfare benefits ended. Given this uncertainty, the wisest course may be to experiment with a variety of types of time-limit provisions on a small scale, rather than implementing such a drastic policy change nationwide.
Figure 1

Figure 2

Figure 3

Chapter 8
Assessing the Personal Responsibility Act
By Sheila Zedlewski and Isabel V. Sawhill
The Personal Responsibility Act (PRA) would replace the 60-year-old Aid to Families with Dependent Children (AFDC) program with block grants to the states. These block grants would fix federal payments at their 1994 levels for the next six years. States would receive grants generally in proportion to current spending and be required to spend the money on cash benefits to needy families with children; but not all needy families with children would be eligible. States would be prohibited from using federal money to provide cash assistance to:
- unmarried mothers under age 18 or their children (until the mother reaches age 18);
- most noncitizens;
- children born while a family is receiving cash assistance; and
- families who have accumulated a total of five years on assistance.
States also would have to pay reduced benefits to children whose paternity is not established. Finally, states would be required to have a certain proportion of their adult caseload working in either subsidized or unsubsidized jobs. This proportion would rise from 10 percent in 1996 to 50 percent by 2003. To the extent that states succeed in reducing their caseload beyond what is mandated by the new law, they could count this toward achieving the work requirement goal.
The federal mandates are designed to promote work and marriage, discourage out-of-wedlock births, and reduce long-term welfare dependency. Except for these mandates, states have broad discretion in using the block grant funds.
ESTIMATING PRA EFFECTS
The provisions contained in the PRA are likely to change as the legislation moves through Congress. Even if they were enacted as written, however, predicting state reaction is fraught with difficulty. Nonetheless, it is useful to estimate the number of families who would be affected by these provisions, assuming that (1) states maintain their current levels of financial assistance, and (2) welfare caseloads do not change significantly. We do this by applying the new PRA rules to a statistical representation of the current caseload to see how it might be affected over time. Later, we relax those assumptions to consider how states and individual recipients might react to the new rules.
Overall Effects
If the PRA were fully in place today, 71 percent of the current caseload would either receive reduced benefits or lose eligibility altogether. Since the PRA would not become effective fully for a number of years, however, the effects would be spread out over time (see Figure 1). Years counted toward the time limit would not begin until 1996, for example, even for those who have already been on the rolls for many years. Thus, no family would be denied assistance because of time limits until 2001, five years after the PRA takes effect.
Denial of benefits to unwed minors and noncitizens would take effect sooner. At the end of 1996, the first year of implementation, 20,000 families would lose all benefits, and more than 750,000 families would find their benefits reduced. After five years, the caseload would be reduced to slightly under four million families from its current level of nearly five million. Under full implementation, the caseload would drop to just under three million families, and an additional 1.5 million families would see their benefits reduced.
Independent Effects of Specific Provisions.
The provision elimina-ting benefits for unwed mothers under age 18 would have a small effect because these families constitute only 1 percent of the current caseload (see Figure 2).
The PRA’s citizenship provisions would eliminate or reduce benefits for 6 percent of the current caseload. Only about 60,000 noncitizen families would lose all benefits, but many more families would receive reduced benefits because they include some noncitizens (for example, families with noncitizen mothers whose children are citizens).
The federal provision denying benefits to children born while the mother is on welfare would eliminate 180,000 families from the caseload, including more than two million children. Overall, about one-quarter of families that currently receive AFDC would either lose some or all of their benefits if this provision were in effect during their time on welfare.
Although the five-year time limit would have no initial effect because of the gradual phase-in, it would eventually eliminate 40 percent of the current caseload. Nearly one out of every two children currently receiving cash assistance is in a family that has received benefits for at least five years.
HOW WOULD THE PRA AFFECT GOVERNMENT COSTS?
The PRA eventually would reduce total federal and state government costs. Total spending (cash assistance plus food stamps) was $37.4 billion in 1993. After full implementation, on the assumption of no caseload growth, cash and food stamp assistance together would decline to $27.4 billion (in 1993 dollars). Federally funded food stamps would increase, partially offsetting the decline in families’ cash benefits. But total federal and state costs for cash benefits would decline sharply, to $11.5 billion—less than the federal block grant scheduled for 1996-2000 ($14 billion annually in 1993 dollars).
Most of the government savings would not be realized until time limits go into effect five years from now (see Figure 3). In the interim, most states would likely have to spend more, not less – both to support rising costs associated with population growth, inflation, and any downturn in the economy, and to fund the services needed to move recipients into jobs as mandated by the new law. The only way for states to avoid spending more would be to find ways to speed up the reductions in their welfare caseloads.
HOW WOULD STATES RESPOND TO THE PRA?
Many states are likely to try to reduce benefits or caseloads even further, for at least three reasons:
Rising Fiscal Pressures.
States will face rising fiscal pressures over the next five years as a result of the capping of federal assistance under the various block grants in the PRA. Federal spending for cash assistance, nutrition, child protection, child care, and disability will be almost $70 billion less than current budget projections over this period. Thus, states will face competing pressures to spend their own limited funds on abused and neglected children, on those who are disabled, and on the other needs of low-income families. Any downturn in the economy would exacerbate these fiscal pressures on states, as will the anticipated increases in the costs of Medicaid at the state level.
Repeal of Federal Matching.
Under current law, the typical state contributes 45 cents of each dollar spent on AFDC, with the federal government contributing 55 cents. Under the PRA, states would bear the full costs of any additional spending—needed, for example, to finance additional training, to maintain benefits during a recession, or to adjust benefits to offset increases in prices. Similarly, if a typical state reduces welfare benefits by one dollar under current law, it saves only 45 cents. Under the PRA it would save a full dollar, more than twice as much. Also, states could get an additional 30 cents in food stamp benefits from the federal government for every dollar reduction in welfare benefits. Thus, repeal of the matching requirement creates a strong incentive for states to cut benefits or restrict eligibility.
State Competition.
In the absence of a federal requirement to provide benefits to all eligible individuals, a “race to the bottom” could occur. Each state has an incentive to compete with other states in lowering its welfare spending out of fear that it will become a haven for the poor and have to raise tax burdens—thereby driving away businesses and the more affluent families so important to the tax base.
One way some states will probably use the increased flexibility provided by the PRA is to choose a time limit shorter than five years. This would have dramatic effects on the number of recipients affected, as well as on government outlays (see Figure 4). Other states might choose to continue to provide benefits to unwed minors or to those who have additional children on welfare, using their own funds for this purpose. Most are likely to continue the feverish pace of program experimentation now underway in almost 30 states under federal waivers. But there would be one critical difference: the elimination of the federal requirement that they evaluate and report on the results.
HOW WOULD INDIVIDUALS RESPOND TO THE PRA?
The estimates in the table on page 36 could overstate the long-run effects of the PRA to the extent that it changes childbearing or work patterns so that fewer families require assistance in the future.
Childbearing.
There is little evidence that cash assistance encourages out-of-wedlock childbearing. But total elimination of benefits for unwed teenage mothers has never been tested, and existing research may not be appropriate for assessing this provision. Studies also suggest that benefit increases for children born on welfare (which average $70 a month) have at most a small positive effect on fertility. Very recent, unpublished evidence from New Jersey’s welfare reform experiment indicates that the PRA’s cap on benefits for additional children may induce a larger response, but it is still too early to assess the reliability of these early estimates.
Work.
Knowing that benefits are time limited is likely to discourage some people from seeking assistance and encourage others to leave the rolls more rapidly. However, there is currently no evidence to predict how large such effects might be.
What about those who reach the time limit and must find other means of support? Those who remain on the rolls for as long as five years are an extremely disadvantaged group. For example, 63 percent of those affected have less than a high school education. Research suggests that most, although not all, of them would try to find jobs—at least part-time jobs. Whether longer-term recipients will be able to obtain and keep jobs, given their lack of education and other personal characteristics, is another question. Under the PRA states could exempt up to 10 percent of their caseload from the limits, acknowledging that some families are not capable of supporting themselves and would face extreme hardship in the absence of cash assistance from the government. But this would not be sufficient to cover all those who are unlikely to become self-supporting or whose presence in the household is essential to the well-being of a child.
CONCLUSION
The PRA would change radically government assistance to needy families with children. Virtually all families would be ineligible for benefits after accumulating five years of assistance, and some would no longer receive assistance even in the short run. The PRA would encourage states to adopt still shorter time limits (or other benefit eligibility restrictions). Otherwise, states will need to increase substantially their own spending on welfare over the next five years to meet new federal work requirements and to finance any caseload growth.
Figure 1

Figure 2

Figure 3

Figure 4

Chapter 9
Will Welfare Recipients Find Work When Welfare Ends?
By Sandra K. Danziger and Sheldon Danziger
Time-limiting welfare is a prominent feature of the current welfare reform debate. The idea first surfaced seven years ago, evolving from a proposal by David Ellwood, currently U.S. Department of Health and Human Services Assistant Secretary for Planning and Evaluation. Ellwood proposed that, following a transitional period, a recipient should be expected to earn wages in a regular job or in a work opportunity provided by the government. In the Ellwood scenario, low wages would be supplemented by the earned income tax credit, subsidized child care and medical insurance, and guaranteed child support. Thus, welfare dependency would be reduced by moving nonworking welfare recipients into the labor force and establishing minimum earning levels for them and other working poor families.
The 1995 welfare reform debate, however, has not focused on the labor market in which welfare recipients would be expected to find jobs to support themselves and their families. It would be wise to do so before implementing such a drastic change as time-limiting welfare on a national scale.
The considerable literature on the link between welfare and work is generally in agreement that, over the past two decades, wage rates for those at the bottom of the skill ladder have fallen in real terms, making it more difficult for the unskilled, who make up the bulk of the welfare caseload, to find a job that will support a family. Direct evidence from the experiences of former recipients in Michigan after it terminated its General Assistance (GA) program in 1991 indicates just how inhospitable the low-wage labor market may be for many would-be workers (at least in Michigan), even when they continue to search for work.
THE MICHIGAN GENERAL ASSISTANCE EXPERIENCE
The findings reported are from a stratified random sample of the GA recipient population in Michigan. Their experience over the two years after leaving the welfare program provides insight into what may happen to AFDC recipients whose benefits are similarly terminated, in this case by time limits.
Until its October 1991 termination, GA was a state-funded cash program providing $160 per month for nonelderly poor adults without dependent children. In the latter respect the sample differed from the AFDC recipient caseload, but in a way that might make them more rather than less able to find and keep jobs. Most of these GA recipients also received state-provided medical coverage and food stamps, before and after the GA termination.
This was not a population without work experience. Three-quarters of former recipients had labor market experience prior to entering GA. Even with this experience, however, the typical respondent searched for, but did not find, stable employment when the program ended. The respondents were interviewed in 1992, one year after benefits ended, and again in 1993, two years after benefits ended. About 40 percent worked at some point in a regular job, typically as restaurant or janitorial workers, in one or the other of the two post-GA years. In the second post-GA year, a little under a third held a regular job; another half worked at odd jobs or casual labor, such as yard work, babysitting, running errands, etc.
Those who had worked at some point since GA benefits ended but were not working at the second interview were asked why they had left their last job. About half were fired or laid off and another sixth quit for health reasons. The remaining third reported quitting for job-related or personal reasons.
Figure 1 divides the 426 respondents to the second-year post-GA interview into eight mutually exclusive categories representing the principal source of cash support available to them in the month immediately prior to the interview. At that point, only 20 percent of them were employed in formal jobs. On average, they earned $5.50 an hour and worked 34 hours a week in the survey month; more than half of this group reported wanting to work longer hours. One-sixth of the sample had earnings from odd jobs or casual labor.
More than a fourth of respondents relied on disability benefits, and about a tenth relied on AFDC, workers’ compensation, unemployment compensation, or pensions. The state of Michigan had expected many recipients to receive financial assistance from family and friends (including private charities). In the year prior to the second post-GA interview, about one-fifth received some cash assistance from friends and about one-third from relatives. The amounts received were quite small because their families and friends also tended to have low incomes. In the month before the second post-GA survey, less than a tenth relied primarily on such help. Another 7 percent relied primarily on a spouse’s earnings or benefits. More than one in eight had no cash income from any source listed.
As reflected in their survey responses, the problem was not failure to look for work. Many former recipients reported regular job search efforts and some expressed willingness to work in return for welfare. Many also expressed frustration with their labor market failures. Three examples typify these reactions.
- A young man applied in response to a Help Wanted sign at a restaurant. He called back a few days later, but was told that the owner would get back to him. “They never called. So another couple of months later they put another sign up again and I was thinking to myself, if they need that much help, why didn’t they hire me, because I qualify for that position?”
- Another man entered GA after unemployment compensation ran out following his layoff from an $18-an-hour unionized manufacturing job. During the two post-GA years he found only one part-time janitorial job paying $5.00 an hour. He was laid off from this job after three months and was never called back.
- One of the women in the sample completed a commercial business training course “because they guaranteed me a job.” She had not found any work in the subsequent two years. She reported that she had sent out 15 to 20 resumes, but had received not a single reply.
Figure 2 presents labor market outcomes for former GA recipients considered most similar to welfare recipients (although GA recipients had no minor children living with them). All male and female respondents (156 from a total sample of 426) who were ages 40 and under in 1991 and who had not qualified for federal or state disability benefits after GA ended were selected. Post-welfare work experience was examined by education level (those who had completed high school or obtained a GED and those who had not).
Two-thirds of this group, regardless of education, held a regular job at some point in the two post-GA years. But the likelihood of regular work depended significantly on education. At the interview two years post-GA, 46 percent of high school graduates were employed, compared with 28 percent of the high school dropouts. The median monthly earnings of the employed were well above the $160 cash general assistance benefit, but still below the poverty line for their family size. Despite the powerful work incentive provided by termination of the program, more than half of the high school graduates remained unemployed.
This is not an encouraging precedent for a time-limited welfare plan that does not provide employment opportunities for welfare mothers unable to find steady work in the regular labor market. These women and their families will no longer be dependent on welfare, but they will be even poorer than they are now.
FINDING WORK IN THE INNER CITY
A recent anthropological study documents the inhospitable nature of the low-wage job market from a different perspective. The study is based on all the job openings filled in 1993 in four fast-food franchises in the Harlem neighborhood of New York. The work histories of the people who got the jobs and the unsuccessful applicants comprised the database. For each job filled, there were 14 job applicants. The job holders were better educated and had better job contacts than the unsuccessful applicants. But the unsuccessful applicants were on average better educated and had more job experience than the typical welfare mother who would face term limits. Of the applicants who were legal immigrants, 40 percent were hired. Of the applicants who were U.S.-born African Americans, only 14 percent were hired. Three-quarters of the rejected applicants continued to search for work but were unemployed when interviewed a year later.
CONCLUSION
The Michigan experience after the termination of its GA program suggests that many current welfare recipients may not find steady employment, even at low wages, if time limits were implemented. One reason is the considerable evidence that employers prefer to hire those with more labor-market skills and experience rather than less. It is the latter group, by and large, that will come up against time limits, if the Personal Responsibility Act or something like it becomes law.
If government enacts time limits without providing some way for former recipients to “work for welfare” or take minimum-wage public-service jobs of last resort, considerably more hardship may result than what the terms of the current debate suggest.
Figure 1

Figure 2
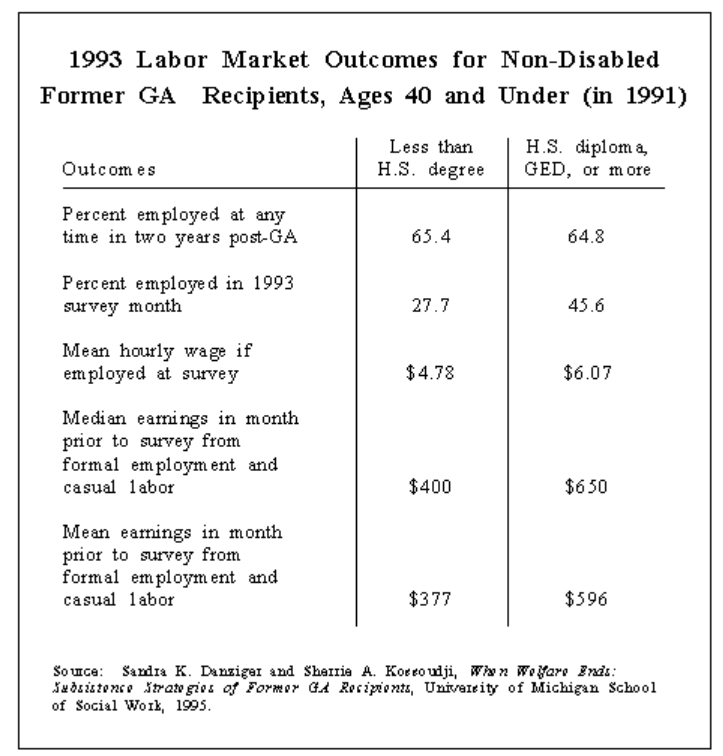
Chapter 10
Teenage Childbearing: The Trends and Their Implications
By Freya L. Sonestein and Gregory Acs
Recent welfare proposals from both sides of the aisle in Congress have focused in an unprecedented way on teenage parents and their children. While earlier reforms like the Family Support Act of 1988 concentrated on job training, supportive services, and child support enforcement, the new reforms acknowledge the need to reduce teenage childbearing. But this consensus on the goal is not matched by agreement on how to achieve it.
The welfare legislation recently passed by the House proposes to replace Aid to Families with Dependent Children (AFDC) and related programs with a block grant to states, which ends universal eligibility for cash assistance among those meeting federal program criteria. Key features of this legislation include its “affirmation of the value of marriage” and its intent to “diminish the number of teenage pregnancies and illegitimate births.” It proposes to achieve these goals, respectively, by denying benefits to children born to mothers already on welfare and denying benefits to children born to unmarried minor mothers.
The Clinton Administration has embraced the concept of “promoting parental responsibility and preventing teen pregnancy.” To achieve this, the administration’s 1994 proposal concentrated services on young parents applying for welfare – those born after 1971. Minors would receive special case management services, and would be required to live at home with their parents (with exceptions for just cause) and to stay in school. The proposal also included a national campaign against teen pregnancy with increased funding for Title X family planning programs; grants to about 1000 schools and community organizations to implement “teen pregnancy prevention” efforts; demonstration grants to as many as seven high-risk, low-income neighborhoods to implement comprehensive social and health services with an emphasis on pregnancy prevention; and a national clearinghouse to evaluate and disseminate information on effective programs.
TRENDS IN CHILDBEARING AMONG TEENAGERS
In light of the current widespread recognition among legislators and the general public that teenage childbearing is a serious social problem, it may come as a surprise that actual birth rates among teenagers are substantially lower today than they were in 1960. In 1960, 89 out of 1000 females ages 15-19 bore a child. By 1980, that birth rate had declined to 53 per 1000 females. It then remained relatively stable for several years, reaching its lowest point in 1986 at 50 per 1000. Since 1986 it has been rising, increasing to 61 per 1000 in 1992 (see chart, Figure 1). The 1992 statistics show some leveling off, but it is not yet clear if this is a trend.
Birth rates to teenagers outside marriage have been increasing, however – a trend that is true also for older women. Since 1960 the birth rate for unwed teenagers has tripled, from 15 to 45 births per 1000 unmarried females ages 15-19. The nonmarital birthrate for teenagers, however, consistently lags behind the nonmarital birth rate for women in their 20s (see chart, Figure 2).
Underlying these trends in teenage fertility are the following changes in marriage patterns, sexual behavior, contraceptive practices, abortion, and the ethnic composition of the teenage population:
- Young men and women are increasingly delaying marriage. In 1960, 14 percent of young women ages 15-19 were married. By 1992, the proportion was less than 5 percent.
- Teenagers are becoming sexually experienced at younger ages. In 1970, 29 percent of 15- to 19-year-old females were sexually experienced, increasing to 52 percent in 1988. Thus, proportionately more teenagers are exposed to the risk of pregnancy and to the risk of nonmarital pregnancy.
- Contraception among sexually active teenagers has increased. This is primarily the result of increased condom use. Higher contraceptive use has partially offset the potential increase in pregnancy from increased sexual activity.
- Declining abortion rates have increased the number of births resulting from pregnancies. In 1972, just prior to Roe v. Wade, one-quarter of all pregnant teenagers terminated their pregnancies. This proportion grew to 46 percent in 1984 and remained steady for several years. But by 1990 the abortion rate for pregnant teenagers had fallen to 40 percent. The rise in birth rates among teenagers since 1986 can be partly explained by the declining abortion rates.
- Birth rates are higher among black and Hispanic teenagers than among white teenagers. The teenage birth rate for Hispanic females was 112 per 1000 in 1992. For blacks it was slightly higher at 116. For white females, 42 out of 1000 teenagers bore a child. Recent increases in birth rates among teenagers may be partly attributable to increases in the numbers of Hispanic teens, who have high fertility rates. Between 1986 and 1991 the number of Hispanic teens increased 12 percent, while the number of non-Hispanic white teens decreased 14 percent.
- Summary of Trends: The teen birth rate today is considerably lower than it was 35 years ago, although somewhat higher than a decade ago. More births occur outside marriage among teens as well as among older women. Increases in sexual experience among teenagers over this period have not resulted in higher birth rates because of increased reliance on contraception and abortion. The recent upturn in teen birth rates is linked to decreases in abortion and to shifts in the composition of the teenage population as the number of Hispanic teens increases. There is no evidence that birth rates among teenagers are rising because more teenagers desire to be parents. Only one-quarter of births to teenagers in 1987 were reported to be intended births.
THE LINK BETWEEN AFDC AND TEEN CHILDBEARING
Although a very small proportion of the current AFDC caseload is composed of families or subfamilies headed by teenage mothers, many older women on AFDC had their first child when they were teenagers. In 1992, mothers under age 20 made up 8 percent of AFDC cases, but 52 percent of the mothers on AFDC had their first children as teenagers. In 1992, total AFDC expenditures for these mothers and their families were estimated at $12.8 billion.
Since 1975, the proportion of AFDC mothers who had their first birth as a teenager has been virtually stable, despite the sharp increase in births among unmarried teens. Thus, rising proportions of nonmarital births among older women may have balanced out any growth in the AFDC caseload that is the result of teenage nonmarital childbearing.
Women who have children as teenagers are more likely to be poor than women who defer childbearing. Analysts are still trying to sort out, however, to what extent the unfavorable economic outcomes are the result of the birth itself rather than preexisting circumstances – like growing up in poverty and having limited educational opportunities.
THE LINK BETWEEN POVERTY AND TEEN CHILDBEARING
Considerable evidence indicates that adolescents from poor families or those with educational deficiencies are more likely than other demographic groups to initiate sexual activity at earlier ages. Although their use of contraception does not appear different from like-aged youth from more advantaged families, contraceptive failure rates are higher and the proportion of unplanned pregnancies ending in abortion is lower. As a result, adolescents in poverty or with educational deficits (which are overlapping populations) are more likely to bear a child. An unplanned birth to a teenager who already faces a bleak economic future is likely to compound the difficulties she faces as she strives to be self-sufficient. However, some women who become mothers as teenagers avoid poverty in their twenties if they complete school and eventually marry.
THE LIVING ARRANGEMENTS OF TEENAGE PARENTS ON WELFARE
Very few mothers under age 18 and on welfare set up separate households. According to the 1990 census, more than half of these mothers (58 percent) live with their parents. Eighteen percent live alone with their children. Twelve percent live with a spouse, and 12 percent live with other adults, which can include cohabiting partners. Thus, in the majority of cases, availability of welfare does not appear to induce poor teens to have children so that they can leave the parental home. Mothers who are older teens (18 and 19) are much more likely to live alone with their children (46 percent) and less likely to live with a parent (33 percent). Given the small number of unmarried teens under the age of 18 who live alone, denying cash benefits to teens may have little effect on the living arrangements of these mothers, but the incomes of the families caring for them will be reduced significantly.
WHAT ABOUT THE FATHERS?
The limited data available on the fathers of the children born to teens under age 18 on AFDC indicate that less than one quarter of these fathers are themselves under the age of 18. On average these fathers are 3.5 years older than the mothers. But a small group of fathers are significantly older. Twenty-one percent of young welfare mothers (under age 18) had partners who were at least five years older. These data suggest that increased paternity establishment and child support enforcement might net more resources for the family than is commonly believed, although an estimated 29 percent of fathers are dropouts or are at least two years behind in school.
While the Personal Responsibility Act (H.R.4) may result in more marriages, paternity establishment, and child support enforcement, the effects of these changes on the well-being of very young mothers and their children are unclear. Some babies born to very young mothers are the result of involuntary sexual encounters. In one survey, three-quarters of females who had sexual intercourse before age 14 reported having had sex involuntarily. Policies that encourage more interaction between fathers and young mothers need mechanisms to exempt young mothers from required contact when abuse is involved.
By denying benefits to those under age 18, the pending legislation may encourage more marriages among the very young. But those marriages are not very durable. Also, young mothers who marry tend to experience reduced educational attainment which interferes with their and their families’ ability to achieve self-sufficiency.
CONCLUSION
One objective of welfare reform – shared by both political parties is to reduce teenage childbearing. However, reducing teenage childbearing is likely to require more than manipulating welfare program participation rules. The key behaviors underlying current trends in teenage childbearing are sexual activity, contraceptive use, and pregnancy resolution (marriage, adoption, abortion, or out-of-wedlock birth). As detailed in an earlier brief, there is little evidence that welfare benefits affect out-of-wedlock childbearing. However, to the extent that they do, it is more likely that they affect pregnancy resolution than sexual activity or the use of contraception. Thus, denial of benefits may have the perverse consequence of increasing abortions and unintended marriages.
If legislators want to reduce teenage childbearing, they are likely to be most successful with policies and programs that are targeted directly to the behaviors that lead to teenage pregnancies—sexual activity and contraceptive use.
Figure 1

Figure 2

Chapter 11
Do Welfare Benefits Promote Out-of-Wedlock Childbearing?
By Gregory Acs
Under the current U.S. welfare system, an unmarried woman with no income can have a child and receive an average of more than $3,500 a year in cash assistance from the Aid to Families with Dependent Children (AFDC) program. This cash provides an unambiguous financial incentive for poor women to have children outside of marriage. Such a perverse incentive, combined with rising out-of-wedlock birth rates, has prompted leading policy analysts and legislators to recommend eliminating welfare assistance to teens completely. The 104th House of Representatives, for instance, has passed legislation abolishing AFDC and replacing it with a block grant that prohibits states from using federal funds to provide cash assistance to teenage single mothers. Such reforms are intended to reduce dramatically the number of children born out of wedlock to mothers who need public assistance. Will the reforms accomplish their objective?
Essentially, this is a question of why women have children out of wedlock and why nonmarital births have been on the rise. Presumably, single women have children for many of the same reasons that married women do. For young women with low socioeconomic status, however, the love provided by a child and the attention and respect accorded to motherhood in the community may be especially important. The rewards of child rearing may appear especially high compared to their other life options. And the cash and other public assistance available to single mothers with children could influence the decision to have a child out of wedlock. But how important is the lure of such welfare assistance relative to other factors?
Some argue that welfare is a critical, enabling factor and that reducing or eliminating benefits would reduce the number of nonmarital births substantially. Others argue that young women are not “future oriented” and do not consider the financial implications of their childbearing decisions. Ultimately, the impact of welfare on women’s childbearing decisions is an empirical question. What is the evidence?
NONMARITAL BIRTHRATE TRENDS
Whether one considers the nonmarital birth ratio (the share of nonmarital to all births) or the non- marital birth rate (the number of births per 1,000 unmarried women of childbearing age), out-of-wedlock childbearing has been on the rise (see Figure 1). Between 1960 and 1990, the nonmarital birth ratio increased fivefold, from 5.3 to 28.0 percent of all births. But it is important to remember that the nonmarital birth ratio can increase if the behavior of single women remains unchanged but fewer married women have children. Thus, it is important to look at the nonmarital birth rate to see whether single women are having more children.
While overall birth rates have dropped from about 88 per 1,000 women of childbearing age in 1970 to 69 births per 1,000 in 1992, the nonmarital birth rate has increased from about 26 to 45. Can welfare be held responsible for this rise?
Some argue that it has played such a role, but this is a difficult case to make. In nominal terms, welfare pays more now, but inflation has eroded most of its value. Since 1970, the real value of AFDC plus food stamps has decreased by more than 25 percent (see Figure 2). The main reason government expenditures on the poor have risen is the skyrocketing cost of Medicaid. But from the point of view of the welfare recipient, Medicaid buys about the same coverage today as in the past: in 1970, the recipient could see a doctor if she or her child got sick; the same is true in 1995. Thus, on balance, a woman on welfare is worse off in 1995 than she was in 1970. Consequently, it is difficult to attribute the rising out-of-wedlock birth rates to rising welfare benefits because, from the point of view of the recipients, benefits have decreased.
THE ATTRACTIVENESS OF ALTERNATIVES TO WELFARE
While a woman on welfare is financially worse off today then a woman on welfare 25 years ago, the alternatives to welfare – work and marriage – also may have grown less attractive. Indeed, given the profound changes in the economy over the past 25 years, perhaps welfare has become a relatively more attractive source of financial support than the alternatives. The financial returns associated with working over the past 25 years have remained about the same for less-skilled women. Their wages did not worsen appreciably, and their employers still rarely provide much in the way of health and other benefits. But the job market for less-skilled and even medium-skilled men has declined precipitously. For example, the real hourly wages of men with only a high school diploma fell by 20 percent between 1973 and 1993. Thus, while welfare has become less attractive over time, the attractiveness of marriage, from a purely economic perspective, also has declined.
STATE WELFARE BENEFITS AND OUT-OF-WEDLOCK CHILDBEARING
Even if there is not a direct correlation between the rise in out-of-wedlock births and trends in benefit generosity, welfare benefits may still influence childbearing decisions. The cornerstone of cash assistance to poor single mothers is AFDC, and AFDC benefits vary from state to state. Thus, if women respond to the monetary incentive to have children, we would expect to see women in higher-benefit states having more children out of wedlock; but this is not the case. Simple comparisons show, in contrast, that nonmarital births are more common in states with lower benefit levels.
These comparisons, however, while straightforward, also can be quite misleading. Low-benefit states may have lower costs of living and/or have a disproportionate number of women at high risk for nonmarital childbearing. Ideally, a thorough analysis would control for differences in young women’s own characteristics as well as differences in the states where they live when trying to isolate the impact of welfare on their decisions to have children out of wedlock. Further, it would be important also to control for the benefit levels and economic circumstances at the time the childbearing decisions were being made.
Unfortunately, no study with these and other necessary controls exists. But many studies using different data sets and slightly different methodologies come up with a relatively consistent finding: white women living in states with higher welfare benefits are a little more likely to have children out of wedlock than white women living in lower-benefit states. But nonmarital births among black and Hispanic women are not significantly correlated with the generosity of welfare (see summary of studies, Figure 3).
The decisions of young mothers on welfare to have additional children also have garnered considerable attention at both federal and state levels. While only a few studies explore the impact of welfare on subsequent births, none finds a direct impact of welfare on continued childbearing. In 1992, New Jersey began denying benefit increases to welfare mothers when they have additional children. Evaluating the impact of this major policy change will greatly enhance our knowledge in this area. However, only preliminary data exist at this time.
Finally, is there any evidence that welfare deters marriage? Yes, there is. Young mothers and pregnant women are slightly less likely to marry in states with higher benefits. In fact, one study finds that virtually the entire impact of welfare on nonmarital births among white teenagers is not through increased pregnancy but through reduced “legitimation.”
All this research employs techniques designed to examine the impact of relatively small changes in benefit levels on birth outcomes. It is indefensible to extrapolate from these results to recommendations for major changes in the nation’s welfare system. Claims that eliminating welfare will virtually eliminate “illegitimacy” are simultaneously unsupportable and irrefutable by conventional social science. Moreover, even if it were the case that by eliminating welfare the nonmarital birth rate would be cut in half, other potential outcomes need to be considered, such as the impact of a policy of this kind on the half-million children who still would be born out of wedlock every year. For most of these children, eliminating welfare would mean subjecting them to lives of intensified poverty, with the serious and long-term negative consequences known to be associated with this condition.
CONCLUSION
In sum, the problem of increasing out-of-wedlock childbirth will likely persist even if welfare is eliminated. Reducing nonmarital childbearing remains an important goal for social policy, but other factors that contribute to out-of-wedlock births should be considered. To the extent that nonmarital birth rates are higher today than three decades ago – not because more women are having children, but because fewer women are marrying – policies aimed at increasing the attractiveness of marriage and the value of work make sense. Such policies could include reducing or eliminating marriage penalties in the tax code and providing education, training, and jobs to young men as well as to young women. Such reforms could raise the monetary value of work and marriage and reduce the attractiveness of welfare dependency. At the same time, it must be recognized that there are larger cultural trends at work here that government may be powerless to reverse.
Figure 1

Figure 2

Figure 3

Chapter 12
The Benefits on Increased Child Support Enforcement
By Elaine Sorensen
Child support reform is a critical component of the current welfare debate. The nearly universal support for it among federal legislators stems, in part, from the expectation that increased child support payments can reduce poverty, welfare dependency, and welfare costs. This note reviews the evidence on this issue and concludes that:
- Noncustodial fathers could pay as much as $34 billion more in child support under an ideal child support system—that is, one in which all noncustodial fathers have a legal obligation set according to the Wisconsin child support guidelines and those obligations are fully paid.
- Under an ideal child support system, poverty and welfare costs among custodial families would decline modestly, with an additional $7 billion of child support going to poor mothers and their children. Although $7 billion is modest relative to the total amount of child support collected, it is quite sizable relative to the likely impact of other policy efforts to improve the economic situation of poor mothers and their children.
- The reason for the modest effects on poverty and welfare costs is that 13 to 26 percent of the noncustodial fathers are poor or have extremely low incomes, limiting their ability to pay child support.
- While an ideal child support system may be a worthy policy goal, it is currently out of reach, because the largest part of the problem is that child support is not always awarded, and establishing those awards is a major undertaking.
WHAT IS THE BASIS FOR THE ESTIMATE OF $34 BILLION?
According to Census data from the 1990 Survey of Income and Program Participation (SIPP), noncustodial fathers paid, on average, only 7 percent of their income in child support. This figure is low primarily because over half of the noncustodial fathers paid no child support. Even among those fathers who paid, more than half spent less than 15 percent of their income on child support.
How much more noncustodial fathers could pay can be estimated by comparing actual child support payments with the child support guidelines Wisconsin uses to determine child support awards. The Wisconsin guidelines are selected because they are easy to understand and they are widely known. In addition, they are not radically different from other states’ guidelines, all of which are based indirectly on studies of the cost of raising children.
The state of Wisconsin applies the following percentages to the noncustodial parent’s income to determine a child support award: 17 percent for one child, 25 percent for two children, 29 percent for three children, 31 percent for four, and 34 percent for five or more.
Using the Wisconsin guidelines, Urban Institute research shows that noncustodial fathers could pay as much as $34 billion more in child support. This represents a three-fold increase in child support payments.
Three factors contribute to the gap between potential and actual child support payments (see Figure 1).
First, not all existing child support awards are paid. One-third of ordered support went uncollected in 1990, representing $7 billion that year. Second, most awards do not reflect parents’ current ability to pay child support. Awards are typically set in fixed dollar amounts that are not updated to reflect changes in the income of either parent or the cost of raising children. If child support awards were adjusted to reflect the current income of noncustodial fathers using the Wisconsin guidelines, another $7 billion of child support would have been awarded in 1990. Third, in many cases there is no child support order. An additional $20 billion could be collected if child support orders were required of every noncustodial father.
CAN ALL NONCUSTODIAL FATHERS AFFORD CHILD SUPPORT?
Although noncustodial fathers as a whole could pay more child support, some could not. In 1990, 13 to 26 percent of noncustodial fathers either lived in a poor family or had personal incomes below $6,800, which was the poverty threshold for an individual that year (see Figure 2). These poverty statistics are even more stark for black noncustodial fathers: 23 to 56 percent of these fathers were poor or had poverty-level incomes in 1990. Almost 90 percent of noncustodial fathers who were poor or had poverty-level incomes in 1990 did not work or worked intermittently that year; nearly half of them had not completed high school.
Under the Wisconsin guidelines, these fathers are not expected to pay much, if any, child support because their incomes are too low, and asking them to contribute would simply shift poverty from one group to another. An important point to keep in mind, however, is that many of these men who cannot afford to pay support are the fathers of the children on Aid to Families with Dependent Children (AFDC).
WHAT CAN INCREASED CHILD SUPPORT PAYMENTS ACHIEVE?
The current child support enforcement system has a modest effect on reducing poverty, welfare dependency, and welfare costs. For example, 800,000 individuals escaped poverty in 1989 because they received child support. But 11.9 million individuals in custodial families remained poor that year.
Under current law, custodial families must assign their rights to collect child support to the state in order to receive benefits from AFDC. Child support collected on behalf of custodial families is distributed partly to the government and partly to the family. AFDC families receive the first $50 of child support collected on their behalf each month. The government retains funds above that to reimburse it for AFDC payments made to the family. In 1989, noncustodial fathers of AFDC children paid $1.5 billion in child support, most of which was retained by the government to help cover the $12 billion in AFDC benefits received by custodial families that year.
What would have happened under an ideal child support system—that is, one in which every noncustodial father had a child support obligation set according to the Wisconsin guidelines, and all orders were fully collected?
- Total welfare costs (i.e., AFDC, Food Stamps, and Medicaid) would have fallen by 9 percent, or $5 billion.
- AFDC participation would have dropped by 9 percent, resulting in 400,000 families leaving AFDC.
- The poverty rate would have declined by 5 percent, lifting 1.4 million individuals out of poverty (see Figure 3).
Thus, an ideal child support system would have modest impacts on welfare costs and poverty because only $7 billion, about 20 percent of the additional child support collected, would go to poor mothers and their children.
While $5 billion of welfare savings is small relative to the total amount of child support that could be collected under an ideal child support system, this number should be placed in a larger policy context. For example, one of the cost-saving measures included in this year’s welfare reform legislation is to convert AFDC into block grants to the states. The Congressional Budget Office estimates that the gross savings from this proposal would be $8 billion over five years, with less than $1 billion of savings in the first year and $2.6 billion in the fifth year. This level of savings could probably be achieved through increased child support enforcement.
WILL ANOTHER $34 BILLION OF CHILD SUPPORT BE COLLECTED?
The $34 billion estimate assumes that three conditions are met: (1) every noncustodial father has been assigned a child support obligation; (2) those awards are set according to the Wisconsin guidelines; and (3) those awards are paid in full. Although assigning every noncustodial father a child support obligation and getting them paid in full may be worthy goals, it is unrealistic to expect to achieve them fully in the near future. In 1990, nearly one-quarter of custodial families without awards said they did not want them. Another 15 percent said that the father could not be located. These figures may change as it becomes easier to obtain awards and locate fathers. But even under the best of circumstances, some families will not pursue a child support award and some fathers will not be located. Furthermore, in 1990 only two-thirds of ordered child support was collected. The collections rate may improve under the proposed reforms, but it is unlikely to reach 100 percent.
Even if these two goals are met, there is no guarantee that awards will be set at the level implied by the Wisconsin guidelines. Each state has enacted its own guidelines for determining child support awards. And many are less generous than those used in Wisconsin. Furthermore, judicial discretion is permitted when setting child support awards. Even in Wisconsin, awards are established according to the Wisconsin guidelines only about half the time.
Although an ideal child support system may be out of reach, it is instructive to understand the potential effects of such a system on poverty and welfare costs. Incremental changes—establishing more awards, increasing award levels, and collecting more of the award amount—can be achieved in the current political climate. And even without reaching the full potential of an ideal child support system, these actions can still improve individual poor families’ ability to raise themselves out of poverty and reduce their dependence on the federal welfare system.
Figure 1

Figure 2

Figure 3

Chapter 13
The Food Stamp Program and the Safety Net
By James C. Ohls
The Food Stamp Program is the only major public benefit program for which eligibility is based solely on need, irrespective of residence or type of family. As such, it is the cornerstone of America’s “safety net” for assisting low-income Americans. With current annual expenditures of $27 billion, the Food Stamp Program serves one in 11 Americans in an average month. This wide reach underlines the importance of considering the role of food stamps in the overall system of income support, and how that role may change if the proposals contemplated in the House-passed Personal Responsibility Act (H.R.4), or something similar to them, become law.
FOOD STAMPS: A PROGRAM OVERVIEW
The Food Stamp Program is an uncapped entitlement with need-based national eligibility and benefit provisions. Benefits are financed entirely by the federal government, although states have to contribute 50 percent of the program’s administrative costs. Begun as a pilot program at local discretion in 1961, food stamps became a national program when federal eligibility criteria and benefit levels were established in 1970. To be eligible for food stamps, a household’s gross income must be less than 130 percent of the poverty level for that family size, and its net income (after allowable shelter and work-related deductions) no higher than the poverty line. Total assets (excluding a family’s home) must be less than $2,000.
Benefit levels, based on the cost of a low-budget, nutritious diet, depend on family size and are adjusted annually to keep pace with inflation. The food stamp benefit formula interacts with state-set AFDC benefit levels. The lower the AFDC benefit, the higher the food stamp benefit in that state.
Since 1985, there has been a job-search and training requirement for adult food stamp recipients who are not elderly, disabled, or already subject to work requirements by their receipt of AFDC.
THE ROLE OF THE PROGRAM
Because it is noncategorical, is adjusted for inflation, and interacts with AFDC benefit levels, the Food Stamp Program plays a major integrating and stabilizing role in the nation’s public assistance system. The program:
Provides a universal safety net.
The importance of food stamps as the only part of the safety net available to all who may fall on hard times is highlighted by the diversity of the caseload (see Figure 1). Somewhat more than 60 percent of food stamp households include children, although only 40 percent of recipient households are also on AFDC. More than 25 percent contain a family member who is elderly or disabled. The remaining caseload reflects diverse overlapping groups, including the working poor, the homeless, and individuals on state or local general assistance.
In addition to providing universal eligibility based on need, the Food Stamp Program sets a nationally uniform minimum benefit level. A major factor in the decision to impose federal standards was a strong political consensus that eliminating hunger and malnutrition is a national objective in the face of evidence of substantial state disparities in meeting this objective.
Provides broader income support as well as food.
It has been argued that restricting the benefit to food reduces its effectiveness as an income support system. The other side of this argument is that the benefit form was designed precisely to ensure that beneficiaries spent enough on food.
Evidence indicates that both the food consumption and income-support functions are being met. For the typical family, an additional dollar of coupon benefits increases food expenditures by between 20 and 40 cents. The remaining 60 to 80 cents of the food stamp benefit dollar are freed up to meet other needs. Food often represents the largest item in many low-income family budgets, and the food stamp benefit – particularly in states with low AFDC benefits—represents the single largest source of household purchasing power.
Reduces interstate benefit disparities
AFDC benefit levels vary widely by state. The food stamp benefit formula reduces this variation by increasing the food stamp benefit by 30 cents for each dollar reduction in the AFDC benefit. In 1991, the combined AFDC and food stamp maximum benefit in Mississippi was $5,900, compared with $11,900 in California. This disparity is still far greater than what is justified by regional cost-of-living differences, but it is 50 percent less than it would be without the interactive food stamp benefit formula.
Softens the Impact of Economic Fluctuations.
Inflation erodes the value of a fixed benefit and rising unemployment increases the number of families needing assistance.
AFDC has no automatic adjustment for benefit erosion caused by inflation. The Food Stamp Program’s automatic cost-of-living adjustment, in contrast, preserves the real value of a recipient household’s food purchasing power.
Under current law, AFDC caseloads can expand as unemployment increases the number of families in need. But the nature of the AFDC caseload renders its countercyclical impact quite modest. During the 1989-1992 recession, AFDC participation increased by only about 11 percent.
The Food Stamp Program has a larger countercyclical impact, given the greater proportion of working poor in its caseload. Food Stamp Program participation was stable (in the 18 to 20 million range) between 1980 and 1988. During the 1989-1992 recession, participation rose from 18.8 million to 25 million persons, almost a 25 percent increase.
CHANGES PROPOSED IN H.R.4
H.R.4 includes six major provisions that would affect the Food Stamp Program. The act:
- limits cost-of-living adjustments to 2 percent a year, less than the current inflation rate for food;
- imposes a work requirement that ends food stamp eligibility after three months for able-bodied food stamp recipients ages 18 to 50 without dependents;
- freezes the ceiling on the deduction from gross income for very high shelter costs, which is included in determinations of eligibility and calculations of benefits;
- permits any state that implements electronic benefit transfer (EBT) to opt for a flat-funded block grant;
- allows states additional flexibility in setting food stamp eligibility and benefit rules for their AFDC populations; and
- makes most legal immigrants ineligible for food stamps.
IMPACTS ON THE PROGRAM’S ROLE
These changes would greatly reduce the integrating and stabilizing role the Food Stamp Program now plays in the U.S. income support system. (Outright block granting of food stamps would almost certainly eliminate that part of its role entirely.)
First, universal noncategorical eligibility would be lost. Able-bodied adults ages 18 to 50 without dependents would no longer be guaranteed assistance. Benefits for welfare recipients could be reduced or cashed out. In addition, any state opting for the EBT block grant option would be free to make all program choices.
Second, the antipoverty effect of food stamps would be weakened, as the 2 percent cap on the cost-of-living adjustment and the absolute cap on the shelter deduction ceiling progressively reduce the real value of the benefit.
Finally, the proposed benefit cuts and increased state discretion would weaken the power of the Food Stamp Program to reduce interstate disparities in AFDC benefit levels disparities that are likely to increase with the block granting of AFDC.
FOOD STAMP OBJECTIVES OF H.R.4
The proposed changes are designed to meet the following set of specific objectives:
Cut costs.
H.R.4 food stamp provisions would produce savings estimated by the Congressional Budget Office at $23 billion over the first five years. The benefit reductions (compared to what would have been provided under current law) would be relatively small at first but would increase over time. The 1996 cut would be 7 percent. By the year 2000 the cut would be 21 percent. By 2005 it would reach 30 percent.
Reduce fraud and abuse.
The U.S. Department of Agriculture (USDA) estimates that about 8 percent of the food stamp benefit expenditures are overpayments or payments to ineligible households. In addition, there is undoubtedly some trafficking (clients exchanging stamps at a discount for cash), although there are no reliable estimates of its extent. H.R.4’s emphasis on state administration and EBT is designed to reduce both types of fraud. A recent USDA investigation shows that the EBT system is not completely invulnerable to fraud. But there is general consensus that it discourages fraud and leaves better audit trails when fraud does occur.
Increase work effort.
The withdrawal of benefits from able-bodied prime-age adults without dependents is designed to provide a powerful incentive to work. The current food stamp employment and training program is widely agreed to be ineffective in increasing employment. One problem is that those subject to the requirement are typically very poorly educated and hard to help. In addition, program funding (at $75 million) is grossly inadequate to provide the education, training, and job search assistance needed to make a real difference in the employability of these recipients. H.R.4 includes funding only at the same level.
Increase state control for better administration.
The argument for more state control is that increased flexibility allows states to be more responsive to local program needs and to save the costs otherwise incurred by having to meet federal standards. With respect to food stamps, the states already have direct responsibility for and considerable leeway in the details of program implementation. There is little hard evidence that more state control would improve efficiency, although it is plausible that making states match the federal benefit expenditures would increase efficiency and reduce payment error. In any case, states could be given substantially more flexibility in running their own programs without eliminating federal standards for basic eligibility and benefit provisions.
CONCLUSION
The Food Stamp Program provides the only universal benefit guarantee for all low-income Americans. As such, it plays a unique role in the current system of means-tested benefits. It also reduces the major welfare disparities among states, and provides protection for the most vulnerable against the hardships inflicted by inflation and unemployment.
In this era of fiscal constraint, the need to examine program reform options for potential cost savings, increased efficiency, and stronger incentives to work is self-evident. And food stamps should be no exception.
As this examination continues and reform options are refined, however, it is important to understand that the size and efficiency of a program bears no necessary relationship to its federal-state structure. It is quite possible for the federal government to maintain responsibility for food stamp eligibility and benefit standards, and to continue to operate food stamps as an entitlement, while still making changes in those standards that would greatly reduce the program’s costs.
It is equally possible to give states considerably more flexibility than they now have in food stamp administration. A trend is already underway in this direction through the current federal waiver process.
The danger is that—in the search for cost-effective improvements and budget savings—the current H.R.4 provisions and ongoing welfare reform discussions are neglecting the potential damage to the fundamental integrating mission of the Food Stamp Program.
Figure 1

Chapter 14
Reforming the Supplemental Security Income Program for Children
By Pamela Loprest
As part of the federal welfare reform effort, major changes have been proposed for the Supplemental Security Income (SSI) program for children with disabilities. The SSI program provides cash benefits to low-income elderly people and low-income people with disabilities (see Figure 1). The proposed changes to SSI for children would:
- restrict eligibility for any benefits by narrowing the disability criteria, and
- replace cash benefits with direct services for most of the children who would remain eligible.
Underlying much of the discussion about these proposed reforms are fundamental questions about the purpose of the SSI children’s benefit. Should it provide income support for low-income families facing the additional hardships of raising a child with a disability? Or should it focus on meeting the specific disability-related needs of children in these families? Questions of which children should be eligible and whether families should receive cash or services are part of this larger debate.
WHY REFORM SSI?
In 1994, 890,000 children received more than $4 billion in SSI benefits. Although SSI expenditures are less than 10 percent of combined federal, state, and local expenditures on children with disabilities including Medicaid, special education, and other programs —the number of children receiving SSI has more than doubled over the last five years (see Figure 2). Over the same period, adult SSI caseloads increased about 30 percent. The growth is due to many factors, including court cases, changes in administrative rules, and extensive outreach.
“Zebley v. Sullivan.”
In 1990, the Supreme Court ruled that SSI did not have disability criteria for children comparable to those of adults, for whom ability to engage in gainful employment is the usual screen. In response, the Social Security Administration (SSA) implemented an Individual Functional Assessment (IFA) process as an additional avenue of eligibility for children. The IFA screens for ability to behave in age-appropriate ways. The General Accounting Office (GAO) found that from 1991 to 1994, about one-third of the children who enrolled in SSI were found to be eligible on the basis of an IFA.
Changes in Eligible Mental Impairments.
In December 1990, SSA began using a revised and expanded list of mental impairments that qualify children for disability assistance. These standards added new mental impairments—such as attention deficit hyperactivity disorder and psychoactive substance dependence disorders—to the list. Awards based on the mental impairment listings almost tripled after these changes, while awards based on physical impairments doubled.
Fraud and Abuse?
Concerns have been raised in the press and elsewhere that some children with only mild disabilities are becoming eligible for SSI, that parents may be coaching children to behave in ways that will make them eligible, and that cash benefits are not always spent on disability-related needs or even on the eligible child. Studies conducted by SSA and the Inspector General’s office have found little hard evidence of such abuse, although they did identify a number of children receiving benefits who should have been denied eligibility. This problem was attributed, in part, to difficulties in interpreting SSI guidelines, particularly the IFA.
PROPOSED CHANGES IN ELIGIBILITY
Proposed SSI reforms would eliminate use of the IFA for children. Disability determination would rely on the listings of specific impairments for children, which would be reviewed annually for potential revision. All children meeting the impairment listings would remain eligible for Medicaid and for services to be funded by block grants to the states. Eligibility for cash benefits would be tightly restricted (see Figure 3).
These proposed reforms would substantially change the current caseload. Of children currently receiving SSI benefits, 21 percent would continue to be eligible for cash benefits under the new rules. Those whose current eligibility is through the IFA fall into two categories. One group (18 percent of current recipients) would lose all eligibility. The other group includes children with conditions that would probably qualify them through the impairment listings to receive block grant services (8 percent of current recipients). An additional 53 percent who are current recipients through the impairment listings would be eligible only for block grant services under the new rules, but would continue to receive cash benefits under a grandfather clause. Of new applicants who would be eligible for cash benefits under current rules, 21 percent would receive cash benefits, 61 percent would receive block grant services, and 18 percent would be ineligible for any benefits.
REPEALING THE IFA
The IFA is a complex, weighted assessment of a child’s functioning or abilities in various domains (cognition, social/behavioral skills, communication, motor skills, concentration, persistence, and pace). It is targeted for elimination partly because of its complexity and its potential for subjective judgment. Many people agree that the IFA needs improvement to reduce these problems. But some of the complexity reflects the inherent difficulty of measuring disability in children. Children are continually developing and a child’s abilities change over time. Also, multiple conditions and impairments combine in ways that can lead to more serious disability than each condition alone.
Many who favor elimination of the IFA assume that—because functional criteria are naturally more subjective—restricting eligibility to medical listings is equivalent to limiting coverage to more serious disabilities. Criteria that are simpler to implement may indeed have the benefit of excluding children with milder disabilities, but they are almost certain to disallow some children with severe disabilities. For example, children who are seriously disabled because of multiple conditions that do not separately meet the severity of the listings may be denied benefits unless some functional assessment is retained.
RESTRICTING CASH BENEFITS
Even prior to SSI’s passage in 1972 there was debate over the appropriateness of providing cash payments to children with disabilities. In adult disability programs, cash benefits are viewed as a replacement for earnings of those unable to work. For children, however, the justification for cash benefits continues to be debated. Are they to help meet additional costs associated with the disability, or to replace the earnings of parents who stay home to care for the children?
Additional Costs.
Evidence on the additional costs associated with children’s disabilities is limited. While data show that costs associated with a relatively small number of children account for a large percentage of total medical expenditures on children, the extent and nature of the needs of these children beyond medical treatment and other publicly available services (such as special education) are largely unknown. What evidence does exist shows that additional costs vary dramatically with type of disability.
Earnings Replacement.
Reforms calling for payments to children needing personal care assistance respond in part to the concern that parents must take time from work to care for a child with a disability. Indeed, the need for replacement earnings is likely to be great, since so many children on SSI (at least 50 percent) live in single-parent families. But formulating appropriate criteria to determine who would require institutionalization if not given personal assistance is difficult, since the decision to place a child in an institution or residential care facility generally depends on the family situation as well as the specific condition. Like the IFA, this decision is inherently open to subjective judgment by physicians, teachers, and administrators who determine disability.
BLOCK GRANTS FOR SERVICES
The ways in which families use SSI benefits have also come under scrutiny. Current rules require that SSI payments be spent on the needs of the child—food, clothing, shelter, medical care, and personal comfort items. Since all beneficiaries are from low-income families, the greatest immediate needs of these children may well include food and shelter. There is no current requirement for SSI payments to be used to meet disability-related needs. In an effort to restrict benefits to such needs, proposed reforms include block grants to states for direct service provision. These grants would give the states considerable discretion. The services must be targeted to the “unique needs of qualifying children that arise from physical and mental impairments.”
In some respects, these services would replace cash benefits for those who do not meet the restrictive criteria for cash but still meet the impairment listings. However, the replacement is not complete. First, states would not be required to serve all children who need a particular service, or offer all services a child may need. And funds to the states would be only 75 percent of current cash benefits. Second, to the extent that cash payments are intended to replace parental earnings (leaving spending choices to the family), services alone do not meet that goal.
More generally, the recent movement toward service provision provides greater assurance that federal funds will be used for the disability-related needs of qualifying children. Other avenues, including voucher systems, may preserve this assurance while still granting a measure of family choice over services. But any new system of noncash benefits is likely to lead to increased administrative costs, particularly since states will need to make their own assessments of children’s service needs.
THE FUTURE OF SSI FOR CHILDREN
That children with disabilities in low-income families are disadvantaged is not debated. And there is general agreement that reforms are needed in the SSI program for children, particularly in how eligibility is determined. But the larger issue of the goal of the SSI program remains unresolved, with some arguing that SSI should remain a form of flexible income support for these children. The proposed legislation before Congress would greatly reduce the role of the SSI program in providing such support.
Figure 1

Figure 2

Figure 3

Chapter 15
When Should Immigrants Receive Public Benefits?
by Michael Fix and Wendy Zimmerman
The welfare reform bill that recently passed the House of Representatives (H.R. 1214) would dramatically curb legal immigrants’ access to needs-based public benefits. The House bill, part of the Personal Responsibility Act (PRA), bars most legal immigrants from Supplemental Security Income (SSI), Medicaid, and Food Stamps, and from services provided under the Temporary Family Assistance (formerly AFDC) and Social Services block grants. It also requires that the income of an immigrant’s sponsor be deemed available to the immigrant for purposes of determining eligibility for all means-tested federal, state, and local programs. This deeming period would last until the immigrant becomes a citizen.
PATTERNS OF WELFARE USE AMONG IMMIGRANTS
Public support for reducing benefits to immigrants is, at least in part, premised on the assumption that welfare use by immigrants is widespread, growing rapidly, and includes those who are here illegally. What are the facts?
First, illegal immigrants are eligible for very few public benefits. The exceptions include emergency medical care, child nutrition, and education. Second, among legal immigrants, it is true that higher proportions of immigrants than of natives use welfare. Closer examination, however, reveals that use is concentrated among two groups – refugees and the elderly (See Figure 1). These two groups represent 40 percent of immigrant welfare users but 21 percent of the immigrant population.
Refugees have high welfare use rates partly because they are fleeing persecution, are often physically or psychologically impaired, and typically have no family or job connections. Their special circumstances suggest that their eligibility for and use of benefits should be considered separately from the remainder of the immigrant population.
Welfare use by elderly immigrants is concentrated in the SSI program. Although immigrants make up only 9 percent of the total elderly population, they make up 28 percent of SSI recipients aged 65 and over. Two factors probably account for their high usage. First, many elderly immigrants have not worked enough in the United States to qualify for Social Security. Second, because it is difficult for elderly immigrants to obtain health insurance, many use SSI as a bridge to Medicaid.
For the rest of the immigrant population-non-refugee immigrants of working age – welfare use is about the same as for U.S.-born Americans (about 5 percent), despite the fact that a larger proportion of immigrants than of natives is poor. Sixteen percent of poor immigrants use welfare, compared to 25 percent of poor natives. However, use of welfare by immigrants appears to have risen in recent years, according to an analysis of March 1994 Current Population Survey and 1990 Census data. This rise is probably due in part to the fact that the 2.6 million immigrants who were legalized under the Immigration Reform and Control Act of 1986 (IRCA) have recently become eligible for benefits following a five-year bar. It may also be attributable to rising enrollment of legal immigrants in the SSI disability program.
LIKELY IMPACTS OF REFORM
The immigrant restrictions in the PRA would cut off large numbers of legal immigrants from services, reduce assistance for some citizens, and shift costs to states, localities, and nonprofit organizations.
Some 569,000 AFDC recipients—three-fourths of all foreign-born recipients—would lose benefits as a result of the bar on immigrants. The bar would eliminate benefits for 62,000 families and result in lower benefits for 252,000 families that include citizens, usually children. The PRA also would exclude 520,000, or three-fourths, of immigrant SSI recipients.
The U.S. Department of Health and Human Services estimates that some 2.2 million legal immigrants may be denied public assistance.
Restrictions on access to benefits by legal immigrants are expected to produce substantial budgetary savings. The reductions in AFDC benefits alone would save $417 million annually; the SSI restrictions would save $2.3 billion annually.
These cutbacks would have the greatest effect on the handful of states where immigrants are concentrated and on two states in particular – California and New York – where about half of all immigrants live. Because these states have higher immigrant welfare use rates and higher payment levels, they would account for 65 percent of the excluded AFDC recipients and 75 percent of AFDC savings.
The PRA allows state and local governments to deny legal immigrants access to state and locally funded programs and requires them to deem sponsors’ income in most means-tested programs. Whether or not states choose to bar immigrants, the six or seven states with the most immigrants will be left with large populations in need. Where no public assistance is available, immigrants would turn to private nonprofit organizations, many of which already face increasing numbers of clients and decreasing funding.
ASSESSMENT OF THE PROPOSALS
Proposals to restrict immigrants’ access to services raise a number of troubling issues. First, these proposals appear to have been driven more by an interest in reducing costs than by any coherent set of principles regarding the access of immigrants to public benefits.
Second, an outright bar on eligibility and the requirement for deeming until citizenship would redefine the status of legal immigrants in our society. Historically, we have made few distinctions between legal permanent residents and citizens, and instead have drawn a firm line between legal and undocumented immigrants. Legal immigrants pay taxes and can be drafted in time of war—the main legal obligations of citizens. Restricting access to public benefits until citizenship would remove rights that have traditionally accompanied these responsibilities. Also, making citizenship the gateway to benefits is troubling because it could induce immigrants to naturalize as a means of acquiring or retaining public benefits and not as an expression of their allegiance to the country.
In addition, the proposals restrict immigrants’ access to a wide range of public assistance programs, including those designed to protect the public health and the health and safety of children, and those that help immigrants to become self-supporting and better integrated into U.S. society. Finally, on purely administrative grounds, the rush to citizenship likely to result would strain the Immigration and Naturalization Service’s already stressed capacity to naturalize immigrants.
PRINCIPLES TO GUIDE REFORM
If current proposals raise so many troubling issues, what types of reforms make sense? We offer four principles to guide discussion. One is the need to prevent an influx of immigrants who become dependent on welfare. A second is the need to promote family—not government—responsibility. For example, adults who bring their elderly parents to this country should assume primary responsibility for their support, at least initially. A third principle is the need to provide a safety net for legal immigrants and their sponsors who fall on hard times and require transitional assistance. A fourth is the need to promote immigrant integration. This suggests making a distinction between programs that provide income assistance and those that provide education, training, or other services that promote mobility.
ALTERNATIVE REFORMS
These principles suggest that the sponsorship and deeming process makes sense, but not for the wide range of programs for which it is required by the PRA.
Sponsorship and Deeming.
Sponsorship and deeming have a strong logic on which reform can build. Under the public charge provision, immigrants can be excluded from the U.S. if they appear likely to become a public charge. One way to overcome this exclusion is to have a sponsor (often a family member) sign a pledge or affidavit of support. The sponsor’s income is then deemed to be available to the immigrant for the purpose of qualifying for three means-tested programs: AFDC, SSI, and Food Stamps. These mechanisms allow the nation to admit immigrants who may be poor at the time of entry but who have the potential to become tax-paying contributors to the economy.
Under the current system, however, the affidavit of support signed by a sponsor is not legally enforceable. Thus, a sponsor may refuse to provide for an immigrant he or she has sponsored even though the sponsor’s income continues to be deemed to the immigrant, usually making the immigrant ineligible for benefits.
Making the Affidavit of Support Enforceable.
This problem could be addressed by making the affidavit of support legally enforceable. If the deeming requirements were waived when a sponsor abandons the immigrant, the immigrant would then have access to a safety net and the state could recoup the funds from the sponsor. Such a policy would serve three purposes: it would discipline sponsors, protect immigrants, and safeguard taxpayers. The PRA makes the affidavit of support enforceable by the government but does not require states to pay benefits in cases where sponsors renege on their commitments.
Also, the current sponsorship system is flawed in that there is no reliable way to determine whether an immigrant has a sponsor. Many eligibility workers now simply ask the immigrant whether he or she is sponsored. One possible long-term solution is to include a code signifying sponsorship on immigrants’ documentation.
How Long Should Deeming Last?
If sponsorship and deeming make sense, but deeming until citizenship does not, how long should deeming last? Should it last three years, as is currently the case for AFDC and Food Stamps? Five years, as is currently the case for SSI? Or some longer, finite period?
One strategy might be to have a uniform five-year deeming period for the programs in which deeming is appropriate. Five years is the period during which an immigrant can be deported for becoming a public charge, the period that most immigrants must wait to apply for citizenship, and the period for which immigrants legalizing under IRCA were barred from benefits. A five-year deeming period would help accomplish the goals of family responsibility and encouraging integration by temporarily restricting access to welfare, while at the same time limiting both the burden imposed on the immigrant and the liability of the sponsor.
Focus on Refugees and the Elderly. In addition to improving the current system of deeming and sponsorship, reforms might also focus on the two groups with the highest rates of welfare use – refugees and the elderly. Since refugees are concentrated most heavily in California and New York, and since welfare use rates are higher there, focusing on the state-run refugee resettlement programs in those states may go a long way toward alleviating refugee welfare dependency.
As many elderly immigrants appear to use SSI to obtain Medicaid, their use may decrease if access to health insurance is expanded. One approach would be to compel the immigrants or their sponsors to buy into Medicare.
Figure 1

What Is Wrong With Our Country?
https://common-sense-in-america.com/2022/05/03/what-is-wrong-with-our-country-lawyers/
https://common-sense-in-america.com/2022/06/10/what-is-wrong-with-our-country-special-interest-groups-and-lobbyists/
https://common-sense-in-america.com/2022/06/14/what-is-wrong-with-our-country-double-standards/
https://common-sense-in-america.com/2022/07/01/what-is-wrong-with-our-country-our-woke-military/
https://common-sense-in-america.com/2022/07/19/what-is-wrong-with-our-country-the-irs-and-our-tax-system/
https://common-sense-in-america.com/2022/07/22/what-is-wrong-with-our-country-our-welfare-system/