


I have written several articles the environment. A list of links have been provided at bottom of this article for your convenience. This article will, however address different aspects on the environment and the planet in general.
This article is about the environment and how CO2 emissions effect Global Warming. In June I wrote an article on Global Warming, entitled “Global Warming and Other Environmental Issues” and an article entitled “Our Western Fires” which also tested base with global warming. This article will be a more in depth study of CO2 emissions and their effects on Global Warming.
In my previous article I discussed natural events such as earth wobble and how it affects the earth temperature and ice ages. Now I will study less large scale changes, such as volcanic activity, forest fires, industrial revolutions. Typically global changes in temperature usually have small yearly fluctuations, however large scale temperature changes usually take hundreds and thousands of years. If you look at the graphs posted below, you will see that our levels of Co2 were steadily climbing every decade, while the levels in the 1970’s were not as high as they are today, the winters were colder than they had been in over 50 years. Now you may ask how is this possible? I don’t know but I do know many weatherman were predicting that we were starting to enter into an ice age. So now 50 years later are CO2 levels have increased steadily and our temperatures are going in the opposite direction. So now we are out of the “ice age” and are experiencing global warming. Humm makes you think what is up?
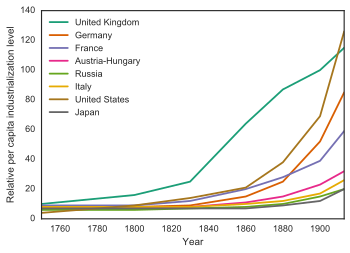
Prior to the 1800’s man produced little CO2. Our industrial revolution has continued from that time to the 1970’s, when we finally put our environment first, and we started cleaning up our act. We followed emission laws, started using unleaded gas, built more fuel efficient cars, added the catalytic converter to reduce pollutants and emissions, stared doing smog checks and so on. Even though our levels of CO2 increased the temperatures seemed to be fluctuating on their own time line.
Lets study the table of historical temperature changes. In 1100 BC we had the highest spike in temperature, even higher than it is today. Now lets look at the CO2 levels for the last 10,000 years. We do this by studying ice core samples. While there is a lot of debate about both temperatures and CO2 levels from millions of years ago. But the evidence is much firmer for the last 800,000 years, when ice cores show that CO2 concentrations stayed tight between 180 and 290 ppm, hovering at around 280 ppm for some 10,000 years before the industrial revolution hit. So according to the ice core samples there still does not seem to be a direct correlation between temperature and CO2 levels. Until the industrial revolution, CO2 levels only fluctuated gradually, but temperatures still fluctuated.
The Pleistocene Epoch is typically defined as the time period that began about 2.6 million years ago and lasted until about 11,700 years ago. The most recent Ice Age occurred then, as glaciers covered huge parts of the planet Earth.
The curious thing about ice ages is that the temperature of Earth’s atmosphere doesn’t stay cold the entire time. Instead, the climate flip-flops between what scientists call “glacial periods” and “interglacial periods.”Glacial periods last tens of thousands of years. Temperatures are much colder, and ice covers more of the planet. On the other hand, interglacial periods last only a few thousand years and the climate conditions are similar to those on Earth today. We are in an interglacial period right now. It began at the end of the last glacial period, about 10,000 years ago.
Scientists are still working to understand what causes ice ages. One important factor is the amount of light Earth receives from the Sun. The amount of sunlight that reaches Earth can vary quite a lot, mainly due to three factors:
- how much Earth is tilted relative to the Sun
- whether Earth wobbles a lot or a little as it spins on its axis (kind of like how a toy top can wobble a lot or a little as it spins)
- the shape of Earth’s orbit as it goes around the Sun (whether it is shaped more like a circle or more like an ellipse or oval)
Over thousands of years, the amount of sunshine reaching Earth changes by quite a lot, particularly in the northern latitudes, the area near and around the North Pole. When less sunlight reaches the northern latitudes, temperatures drop and more water freezes into ice, starting an ice age. When more sunlight reaches the northern latitudes, temperatures rise, ice sheets melt, and the ice age ends. But there are many other factors. Ice core samples tell us that during the current ice age, climate on Earth has flip-flopped between glacial and interglacial periods at least 17 times!
So it is very likely that Earth will turn cold again, possibly within the next several thousand years. But, we have to keep in mind that human activities today are impacting climate on a global scale. So when we predict future climate changes, including the next glacial period, we need to consider the changes that humans are causing.


Before the industrial revolution, the CO2 content in the air remained quite steady for thousands of years. Natural CO2 is not static, however. It is generated by natural processes, and absorbed by others.
So, it is evident that we really don’t know if the CO2 increases have had any affect at all on the temperature of the earth. We could be in micro temperature changes, that just occur for unknown reasons, or we could activity cold be speeding up these cycles. We can agree that volcanoes and fires are naturally occurring events. They are some of the more obvious naturally occurring producers of CO2. But the question is, how much CO2 do they really produce? I will also check out what our activities do to increase these levels. So more charts and tables.
CO2 Produced By Nature

As you can see in Figure 1, natural land and ocean carbon remains roughly in balance and have done so for a long time – and we know this because we can measure historic levels of CO2 in the atmosphere both directly (in ice cores) and indirectly (through proxies).

Figure 1: Global carbon cycle. Numbers represent flux of carbon dioxide in gigatons (Source: Figure 7.3, IPCC AR4).
Volcanoes:
Iceland’s Eyjafjoell volcano is emitting between 150,000 and 300,000 tonnes of carbon dioxide (CO2) per day, a figure placing it in the same emissions league as a small-to-medium European economy, experts said on Monday.
Assuming the composition of gas to be the same as in an earlier eruption on an adjacent volcano, “the CO2 flux of Eyjafjoell would be 150,000 tonnes per day,” Colin Macpherson, an Earth scientist at Britain’s University of Durham, said in an email. Patrick Allard of the Paris Institute for Global Physics (IPGP) gave what he described as a “top-range” estimate of 300,000 tonnes per day. Both insisted that these were only approximate estimates. Extrapolated over a year, the emissions would place the volcano 47th to 75th in the world table of emitters on a country-by-country basis, according to a database at the World Resources Institute (WRI), which tracks environment and sustainable development. A 47th ranking would place it above Austria, Belarus, Portugal, Ireland, Finland, Bulgaria, Sweden, Denmark and Switzerland, according to this list, which relates to 2005. Experts stressed that the volcano contributed just a tiny amount – less than a third of one percentage point – of global emissions of greenhouse gases.
Fires:
It’s complicated: While CO2 causes long-term warming, aerosols can have both a warming and a temporary cooling effect.
The extreme wildfires sweeping across parts of North America, Europe and Siberia this year are not only wreaking local damage and sending choking smoke downwind. They are also affecting the climate itself in important ways that will long outlast their flames.
Wildfires emit carbon dioxide and other greenhouse gases that will continue to warm the planet well into the future. They damage forests that would otherwise remove CO2 from the air. And they inject soot and other aerosols into the atmosphere, with complex effects on warming and cooling.
To be sure, the leading cause of global warming remains overwhelmingly the burning of fossil fuels. That warming lengthens the fire season, drying and heating the forests. In turn, blazes like those scorching areas across the Northern Hemisphere this summer have a feedback effect—a vicious cycle when the results of warming produce yet more warming.
Although the exact quantities are difficult to calculate, scientists estimate that wildfires emitted about 8 billion tons of CO2 per year for the past 20 years. In 2017, total global CO2 emissions reached 32.5 billion tons, according to the International Energy Agency.
When they calculate total global CO2 output, scientists don’t include all wildfire emissions as net emissions, though, because some of the CO2 is offset by renewed forest growth in the burned areas. As a result, they estimate that wildfires make up 5 to 10 percent of annual global CO2 emissions each year.
There have always been big wildfires, since long before humans began profoundly altering the climate by burning fossil fuels. Those historical emissions are part of the planet’s natural carbon cycle. But human activities, including firefighting practices, are resulting in bigger, more intense fires, and their emissions could become a bigger contributor to global warming.
Extreme fires can release huge amounts of CO2 in a very short time. California fire experts estimate that the blazes that devastated Northern California’s wine country in October 2017 emitted as much CO2 in one week as all of California’s cars and trucks do over the course of a year. This year’s fires have also been extreme; two of the state’s largest fires on record are burning right now, including the Mendocino fire complex, which exceeded 400,000 acres this week.
According to NOAA scientist Pieter Tans, head of the carbon cycle greenhouse gases group with the Greenhouse Gas Reference Network, a very large, very hot fire destroying 500,000 acres could emit the same total amount to CO2 as six large coal-fired power plants in one year.
That suggests that California’s wildfires in recent years may be releasing enough CO2 to endanger the state’s progress toward meeting its greenhouse gas reduction targets.

While fires have been worsening in some regions, globally the total burned area and emissions from wildfires have actually decreased over the past 20 years, said Guido van der Werf, a Dutch researcher who analyzes trends for the Global Fire Emissions Database. The global decline is because burned savannas and rainforests in the tropics are being converted to agricultural lands, which are less fire-prone.
In regions of the world drying out with global warming, like the U.S. West and the Mediterranean, however, extreme fire seasons have increased in recent years.
“If we start to see a higher level of fire activity than in the past because of global warming, they become part of a climate feedback loop,” van der Werf said. That means warming causes more fires, which causes more warming.
In addition to their CO2 emissions, wildfires can affect the climate in other important ways.
Dead Wood and Changes to the Land
Fires don’t just burn up trees and shrubs and emit smoke. They leave behind long-lasting changes on the ground, and those changes also have effects on the climate.
Over the course of several decades after a big fire, emissions from decomposing dead wood often surpass by far the direct emissions from the fire itself. But at the same time, new growth in burned areas starts to once again take CO2 from the atmosphere and store it.
Fires also change the reflectivity of the land, called albedo. As burned forest areas start to regrow, lighter-colored patches of grasses and shrubs come in first, which, because they reflect more solar radiation, can have a cooling effect until the vegetation thickens and darkens again.
Scott Denning, an atmospheric scientist at Colorado State University, says site-specific studies show that the cooling effect in northern forests can last for decades. In a tropical rainforest, on the other hand, the dark canopy can regrow within a few years.
When new trees grow fast, they can start stashing away significant amounts of carbon quickly. But some recent research suggests that global warming is preventing forest regrowth after forest fires, including along the Front Range of Colorado and in the forests of the Sierra Nevada. If that emerges as a widespread trend in the coming decades, it means less forests available to take CO2 out of the atmosphere. Forests are estimated to absorb up to 30 percent of human greenhouse gas emissions.
Aerosols’ Cooling and Warming Effects
Scientists can’t say for certain whether the global level of fire activity in recent years is warming or cooling the atmosphere overall. Part of the reason that they don’t have a definitive answer is because, along with CO2, wildfires also produce many other volatile organic particles called aerosols, including substances like black carbon and gases that form ozone.
One recent study suggests that wildfires emit three times more fine particle pollution than estimated by the Environmental Protection Agency. This pollution creates health problems, and scientists are also working to better understand its impact on the climate.
Some of those aerosols can make the atmosphere more reflective. They block sunlight, which cools the atmosphere, similar to the effect attributed to emissions from volcanic eruptions. In general, the climate effect of aerosols is short-lived, lasting from a few months to a couple of years.
But black carbon, an aerosol and short-lived climate pollutant, can actually absorb heat while floating around in the air, and that heats the atmosphere. Recent research shows that the heat-trapping potency—though it is short-lived—is much higher than previously thought, roughly two-thirds that of carbon dioxide, according to Alfred Wiedensohler, with the Leibniz Institute for Tropospheric Research.
Megafires may intensify these emissions and send them higher into the atmosphere. A study published this week found that wildfires in Canada in 2017 resulted in extreme levels of aerosols over Europe, higher than those measured after the 1991 Mt. Pinatubo eruption.
An increase in megafires, driven at least partly by global warming, could change the wildfire carbon cycle, said Mark Parrington, a senior scientist with the European Centre for Medium-Range Weather Forecasts Copernicus Atmosphere Monitoring Service.
“In general, if we’re seeing an increase in megafires, with direct injections (of pollutants) into the upper atmosphere, the effects can linger for weeks or months, and that could have more of a climate-cooling effect,” he said.
More pieces to the wildfire-climate puzzle will fall into place after scientists evaluate data gathered by a C-130 airplane that’s making daily cruises near Western U.S. wildfires to take detailed measurements of wildfire emissions. The mission is sponsored by the National Center for Atmospheric Research and the National Science Foundation.
With the explosion of wildfires in the region the past few decades, the data will help evaluate impacts to human health and the environment, including nutrient cycling, cloud formation and global warming, said University of Wyoming atmospheric scientist Shane Michael Murphy, one of the project researchers.
Wind-Blown Soot Can Affect the Ice Sheets
Eventually, the skies will clear once again, but all that smoke doesn’t just magically disappear. The CO2 will heat the atmosphere for centuries; the methane for a few decades. Some of the aerosols and other particles are heavy enough to drift earthward, and others will wash to the ground with the first good rains of autumn or winter, but not before spreading out over the Northern Hemisphere’s oceans and continents.
The overall effect of wildfire fallout on Arctic melting is difficult to quantify, partly because of sparse sampling across the remote area, and partly because of the great annual variations in wildfire emissions. But a growing body of research suggests that wildfire soot will contribute to accelerating the Arctic meltdown in the decades ahead.
Man-made CO2 Emissions:
Based on the best estimates of CO2 emissions from wildfires, Denning said they are dwarfed by emissions from the burning of coal, oil, and gas, and that’s where the focus should be on reducing emissions.
“Without very strong climate policy, industrial emissions are likely to triple in this century. Against that backdrop, the climate effects of increased wildfires are smaller than the error bars in the climate effects of all that coal, oil, and gas,” he said.

So right now the natural production of Co2 around 10%, however with the large scale of forest burned down, it reduces their ability to absorb some of that CO2 and what is just as important produce O2. We need plant life to convert the poisonous CO2 and turn it into breathable Oxygen. It is estimated that forests alone absorb 30% of the global CO2. We also have to factor in the deforestation of the the Amazon forest. It is estimated that this forest, alone produces 6 % of the world’s Oxygen.
Consequences and ImpactsTackling Climate Change Through Livestock, a widely-cited 2013 report by the UN Food and Agriculture Organization (FAO), estimates about 14.5 percent of global GHG emissions, or 7.1 gigatons of CO2 equivalent, can be attributed to the livestock sector annually.


Global Emissions by Economic Sector
Global greenhouse gas emissions can also be broken down by the economic activities that lead to their production. Source: IPCC (2014); EXIT based on global emissions from 2010. Details about the sources included in these estimates can be found in the Contribution of Working Group III to the Fifth Assessment Report of the Intergovernmental Panel on Climate Change. EXIT
- Electricity and Heat Production (25% of 2010 global greenhouse gas emissions): The burning of coal, natural gas, and oil for electricity and heat is the largest single source of global greenhouse gas emissions.
- Industry (21% of 2010 global greenhouse gas emissions): Greenhouse gas emissions from industry primarily involve fossil fuels burned on site at facilities for energy. This sector also includes emissions from chemical, metallurgical, and mineral transformation processes not associated with energy consumption and emissions from waste management activities. (Note: Emissions from industrial electricity use are excluded and are instead covered in the Electricity and Heat Production sector.)
- Agriculture, Forestry, and Other Land Use (24% of 2010 global greenhouse gas emissions): Greenhouse gas emissions from this sector come mostly from agriculture (cultivation of crops and livestock) and deforestation. This estimate does not include the CO2 that ecosystems remove from the atmosphere by sequestering carbon in biomass, dead organic matter, and soils, which offset approximately 20% of emissions from this sector.[2]
- Transportation (14% of 2010 global greenhouse gas emissions): Greenhouse gas emissions from this sector primarily involve fossil fuels burned for road, rail, air, and marine transportation. Almost all (95%) of the world’s transportation energy comes from petroleum-based fuels, largely gasoline and diesel.
- Buildings (6% of 2010 global greenhouse gas emissions): Greenhouse gas emissions from this sector arise from onsite energy generation and burning fuels for heat in buildings or cooking in homes. (Note: Emissions from electricity use in buildings are excluded and are instead covered in the Electricity and Heat Production sector.)
- Other Energy (10% of 2010 global greenhouse gas emissions): This source of greenhouse gas emissions refers to all emissions from the Energy sector which are not directly associated with electricity or heat production, such as fuel extraction, refining, processing, and transportation.
Conclusion:
Although our output of 29 gigatons of CO2 is tiny compared to the 750 gigatons moving through the carbon cycle each year, it adds up because the land and ocean cannot absorb all of the extra CO2. But consider what happens when more CO2 is released from outside of the natural carbon cycle – by burning fossil fuels. About 40% of this additional CO2 is absorbed. The rest remains in the atmosphere, and as a consequence, atmospheric CO2 is at its highest level in 15 to 20 million years (Tripati 2009). (A natural change of 100ppm normally takes 5,000 to 20,000 years. The recent increase of 100ppm has taken just 120 years).
Human CO2 emissions upset the natural balance of the carbon cycle. Man-made CO2 in the atmosphere has increased by a third since the pre-industrial era, creating an artificial forcing of global temperatures which is warming the planet. While fossil-fuel derived CO2 is a very small component of the global carbon cycle, the extra CO2 is cumulative because the natural carbon exchange cannot absorb all the additional CO2.
As I have shown earlier, their are still questions on how much affect CO2 has on global warming. As I stated earlier, it seems that temperatures change irregardless of CO2 levels.
Even though we have made incredible advances in our understanding of our world, we still have major gaps in our knowledge. We know that our time on this planet has had a negative impact on the environment and our impact on the animal kingdom has been nothing short of catastrophic. However, nature has a way of taking care of its self and correcting imbalances, but in order for mother nature to do her job, we have to reduce our footprint on the planet.
Resources:
theguardian.com, “Iceland volcano gives warming world chance to debunk climate sceptic myths,” By Leo Hickman; notalotofpeopleknowthat.wordpress.com,” In The 1970’s, Cold Winters Were Due To Global Cooling!” By Paul Homewood; amnh.org, “When and How did the ice age end? Could another one start?” By Ro Kinzler; insiderclimatenews.org, “How Wildfires Can Affect Climate Change (and Vice Versa),” By Bob Berwyn; nationalgeographic.com,”Why the Amazon doesn’t really produce 20% of the world’s oxygen,” By Katarina Zimmer; skepticalscience.com, “How do human CO2 emissions compare to natural CO2 emissions?” By GP Wayne;
Environmental Postings
https://common-sense-in-america.com/2020/10/18/why-2-2-doesnt-4-and-an-apple-is-not-an-orange/
https://common-sense-in-america.com/2020/10/17/forest-fires-and-other-natural-disasters-and-their-effect-on-the-environment/
https://common-sense-in-america.com/2020/10/08/sharks-sharks-everywhere-oh-my/
https://common-sense-in-america.com/2020/10/06/natural-selection-and-evolution/
https://common-sense-in-america.com/2020/09/16/our-western-fires/
https://common-sense-in-america.com/2020/09/12/the-creation-of-our-planet-is-a-miracle-and-should-be-cherished/
https://common-sense-in-america.com/2020/06/19/global-warming-and-other-environmental-issues/
https://common-sense-in-america.com/2020/06/12/protecting-our-heritage-saving-endangered-species/