


I have written several articles Racism and Slavery. A list of links have been provided at bottom of this article for your convenience. This article will, however address different aspects on Racism and Slavery.
Immigration Has Been a Defining, Often Contentious, Element Throughout U.S. History
As host to more immigrants than any other country, the United States has been shaped and reshaped by immigration over the centuries demographically, economically, culturally, socially, and politically. Newcomers have driven fundamental U.S. transformations during four peak periods of significant immigration: establishment of the British colonies, westward expansion and the shift to an agricultural economy in the 19th century, the rise of cities and manufacturing at the turn of the 20th century, and the recent dominance of a services- and knowledge-based economy beginning in the 1970s and continuing today.
Even as immigration has been a regular feature of American life, it has also been historically contentious and in recent decades has been seen through an increasingly partisan lens. While the United States continues to rely on immigration to bolster population growth, for family reunification, and to fill job needs, the system no longer keeps pace with these demands. The country’s present-day immigration framework was mostly constructed in the 1950s and 1960s, and the last major legislative reforms occurred in 1996. Since then, immigration has become a partisan wedge issue within Congress and the country, with fights chiefly concentrated on the fate of the estimated 11 million unauthorized immigrants in the United States, one of the largest such populations in the world, and enforcement measures at the U.S.-Mexico border. In the face of serious roadblocks to changing immigration laws, recent presidential administrations have increasingly governed through executive action, which has allowed them each to put their mark on the system—at least temporarily.
Although the foundational tenets of the immigration system have remained mostly unchanged over the past several decades, the immigrant population has grown significantly. As of 2019, 44.9 million immigrants lived in the United States—more than double the 1990 number—representing nearly 14 percent of the country’s total population, the highest share since 1910. Immigrant origins are also shifting, with recent arrivals from China and India outpacing those from Mexico, and the overall number of Mexican immigrants declining since 2010. And after peaking at an estimated 12.3 million in 2007, the unauthorized immigrant population has decreased and mostly leveled out around 11 million.
As a result of these shifts, anxieties that have traditionally accompanied sizeable demographic changes, post-9/11 policies that rooted immigration in a new national security narrative, and other factors, immigration has become central to U.S. political debates, helping to propel leaders with ardent but strongly diverging views on the issue. Attempts at major legislative reform have crumbled in the face of such increasing partisanship. This article covers the history of immigration to the United States, provides data on the size and characteristics of the present-day immigrant population, and reviews prospects for future developments.
How Has the Approach to Immigration Changed Throughout U.S. History?
Prior to 1880, immigration to the United States was primarily European, driven by forces including religious and political persecution, crop failure, and the expanding frontiers of the American West and the U.S. industrial revolution. Arrivals of enslaved people from Africa and the Caribbean were high throughout the 18th century but declined dramatically after 1810 and ended in 1861. Chinese immigrants began to arrive in large numbers after gold was discovered in California in 1848.
It was only in 1875 that the U.S. government began to restrict immigration; until that time, virtually all arrivals were admitted. The Immigration Act of 1875 (also known as the Page Act) barred the admission of criminals and made it a felony to import Asian forced laborers and Chinese women. The 1882 Immigration Act further prohibited entry of anyone deemed a “convict, lunatic, idiot, or person unable to take care of himself or herself without becoming a public charge,” and set a fee for arriving noncitizens that would be used to regulate immigration. As the gold rush ended, animosity toward Chinese laborers and other immigrants surged, leading to a further series of racially restrictive immigration laws. The Chinese Exclusion Act of 1882 halted immigration of Chinese laborers for ten years, barred Chinese naturalization, and provided for the deportation of unauthorized Chinese immigrants. Follow-on laws in 1888 and 1892 further restricted immigration from China.
Between 1880 and 1930, more than 27 million immigrants arrived, mainly from Europe and Canada. This peak immigration period—the last major wave prior to the current era—also led to new restrictions. Among them was the 1917 Immigration Act, which prohibited immigration from a newly drawn “Asiatic barred zone” covering most of South and Southeast Asia and nearly the entire Middle East, as well as other groups of migrants such as those who could not pass a literacy test. The Immigration Act of 1924 (also known as the Johnson-Reed Act) established the national-origins quota system, which set a ceiling on the number of immigrants allowed from each country, highly preferencing those from Northern and Western Europe. The 1924 law included no provisions for immigration from South and Central America or Mexico.
The Creation of the Modern U.S. Immigration System
Two decades later, the tides slowly started to turn. In 1943, the Chinese Exclusion Act was repealed after more than 60 years. The 1952 Immigration and Nationality Act continued the national-origins quota system but for the first time allocated a quota for Asian countries. A new philosophy guiding immigration eventually took hold as part the nation’s civil-rights movement, and the resulting Immigration and Nationality Act Amendments of 1965 (the Hart-Cellar Act) repealed the national-origins quota system and replaced it with a seven-category preference system based primarily on family unification. By ending strong preferences for European migration and increasing numerical limits on immigration, the landmark 1965 law set in motion powerful forces that still shape the United States today. Immigration flows that had long been dominated by Europeans gave way to predominantly Latin American and Asian immigration.
Figure 1. U.S. Immigrant Population by Region of Birth, 1960-2019
Source: Migration Policy Institute (MPI), “U.S. Immigrant Population by World Region of Birth, 1960-2019,” MPI Migration Data Hub, accessed December 9, 2021, available online.
The Hart-Cellar Act also for the first time created a permanent admissions category for refugees. Previously, refugees had been allowed into the United States only under the attorney general’s parole authority (this power continued to be used after 1965 to admit refugees beyond the admissions cap). Later, the Refugee Act of 1980 established the modern U.S. refugee system, including authorizing the president to set annual admissions targets, creating the asylum system, and providing a pathway to permanent residence for refugees and asylees.
Though Congress in 1964 terminated the World War II-era Bracero program used to recruit Mexican workers for U.S. farms, the 1965 Act helped usher in a new era of migration from Mexico. As Mexico became the largest source country for legal admissions, it also became the origin for a growing population of unauthorized migrants coming in search of jobs; by the mid-1980s, an estimated 3 million to 5 million immigrants were living unlawfully in the country.
The Immigration Reform and Control Act of 1986 (IRCA) was intended to address and end illegal immigration with a “three-legged stool” approach: penalize employers who knowingly hired unauthorized immigrants, increase border enforcement, and offer legal status to unauthorized immigrants who had lived in the United States for at least five years (with more leniency for agricultural workers). The law granted legal status to 2.7 million individuals, but it never accomplished its goal of ending illegal immigration. Many unauthorized immigrants were not eligible for legalization under the law’s provisions, and the measure also did not provide for newly legalized immigrants to reunite with their relatives. Meanwhile, policing of employers was minimal and border enforcement was slow to scale up.
Four years later, the Immigration Act of 1990 sought to ease entry for highly skilled immigrants by raising legal immigration caps, creating a preference system for employment-based immigration, and modifying categories for temporary visas, among other changes. It also established Temporary Protected Status (TPS) for nationals of countries deemed unsafe for return because of armed conflict or natural disaster, as well as the Diversity Visa Program, which allots green cards for immigrants from countries with little immigration to the United States.
The continuing rise in illegal immigration sparked a backlash that prompted Congress in 1996 to pass laws that included strict immigration provisions. Among these were the Illegal Immigration Reform and Immigrant Responsibility Act (IIRIRA), which significantly expanded the number of crimes that are defined as aggravated felonies and subject noncitizens to removal, provided for expedited removal of inadmissible noncitizens, barred unauthorized immigrants for long periods of time from re-entry, and set income requirements for immigrants’ family sponsors at 125 percent of the federal poverty level. IIRIRA also required the government to track foreign visitors’ entries and exits, which became a key element in the government’s security strategy after the terrorist attacks of September 11, 2001. In 1996, Congress also revised federal welfare law with passage of the Personal Responsibility and Work Opportunity Reconciliation Act (PRWORA), which denied some legally present immigrants access to benefits such as Medicaid and food stamps. Finally, that year lawmakers passed the Antiterrorism and Effective Death Penalty Act (AEDPA), making it easier to arrest, detain, and deport noncitizens.
9/11 and the Securitization of Immigration
For much of U.S. history, debates about immigration had centered on economic, national-origin, and public-safety arguments. Since 9/11, national security concerns moved to the forefront. The government in 2002 created the Department of Homeland Security (DHS) by merging 22 federal agencies, including the U.S. Immigration and Naturalization Service (INS), which had been the national immigration agency since 1933. Within DHS, INS was replaced by three new agencies to manage immigration: U.S. Customs and Border Protection (CBP), which oversees the entry of all people and goods; U.S. Immigration and Customs Enforcement (ICE), which enforces immigration and customs laws in the U.S. interior; and U.S. Citizenship and Immigration Services (USCIS), which adjudicates immigration applications.
The national security focus led to increased scrutiny and sometimes targeting of immigrant communities. Shortly after 9/11, more than 1,000 foreign nationals deemed potential threats were arrested. Officials also established the National Security Entry-Exit Registration System (NSEERS) requiring noncitizen men from a group of largely Muslim-majority countries to submit fingerprints and other information upon entering the United States, and DHS later replaced it with the U.S. Visitor and Immigrant Status Indicator Technology (US-VISIT) program to collect biometrics from all foreign nationals entering the country.
Other expanded enforcement activities included the Secure Fence Act of 2006, which directed DHS to establish a system of technology and at least 700 miles of barriers at the nearly 2,000-mile U.S.-Mexico border. Meanwhile, ICE increasingly worked with local law enforcement agencies to drive up interior arrests of unauthorized immigrants and other removable noncitizens, including by deputizing local law enforcement agents to enforce immigration laws. The more than 320,000 ICE arrests in fiscal year (FY) 2011 marked a record high.
As the roles of the immigration agencies grew, so did their funding. The $25.1 billion appropriated for immigration enforcement in FY 2020 (which went to CBP, ICE, and the Office of Biometric Identity Management) was nearly five times the $4.3 billion allocated in FY 2000. It was also 28 percent more than the combined $19.5 billion spent on the federal government’s principal criminal law enforcement agencies (the Federal Bureau of Investigation, Drug Enforcement Administration, Secret Service, U.S. Marshals Service, and the Bureau of Alcohol, Tobacco, Firearms, and Explosives).
Aggressive immigration enforcement drew pushback from immigrant-rights advocates, leading to various kinds of so-called sanctuary policies restricting state and local police from cooperating with ICE in places such as California, the Chicago area, and New York City. The 2016 election of President Donald Trump, who promised to deport millions of unauthorized immigrants, further spurred this trend, and eventually birthed a movement among some progressive activists to “abolish ICE.” One effect was that Democratic lawmakers became more hesitant to support increases in immigration enforcement resources and effort, after two decades of dramatic, sustained growth.
The Political Divide Deepens
In the post-9/11 era, lawmakers made multiple attempts to enact comprehensive immigration legislation that traded increased enforcement for paths by which unauthorized immigrants could gain legal status and eventually citizenship. But these efforts failed repeatedly, most notably in 2006, 2007, and 2013. With Republicans increasingly focused solely on prioritizing enforcement and Democrats motivated chiefly by legalization, hopes of reaching a legislative grand bargain have faded. Even legal immigration has become a point of increasing political contention, representing a turning point from the longstanding bipartisan consensus that illegal immigration should be discouraged but that legal immigration benefits the country.
Changing demographics are the backdrop to the shift away from compromise. Hispanic, Asian-American, and Black voters have grown as a share of the electorate, while the share of non-Hispanic White voters is shrinking, affecting the makeup of registered Democrats more than Republicans. Nonwhite voters accounted for 40 percent of Democrats in 2019, up from around 24 percent in 1996; meanwhile, they accounted for 17 percent of Republicans in 2019, up from 6 percent in 1996. The share of Hispanic voters in particular, some of whom have been among the most vocal advocates for immigrant rights, nearly tripled from 4 percent in 1996 to 11 percent in 2019 (as a whole, though, Hispanics rarely cite immigration as their top priority).
Congressional inaction and increasing partisan polarization have set the conditions for presidents to make immigration changes through executive action. One early example was the Obama administration’s 2012 Deferred Action for Childhood Arrivals (DACA) program, which provides temporary protection from deportation and work authorization to some unauthorized youths who arrived in the United States as children.
Trump took full advantage of the executive branch’s powers. Through FY 2019, a higher share of Trump’s executive orders and presidential proclamations were immigration-related than any other president since 1945. Overall, his administration took more than 500 executive actions on immigration, according to Migration Policy Institute (MPI) analysis, including headline-generating travel bans on nationals of mostly Muslim-majority countries and redirecting Pentagon funds to build a border wall. More under-the-radar moves included encouraging consular officers to authorize visas for shorter durations and raising standards for initial asylum screening interviews. Despite some early losses in lower courts, presidents’ ability to use executive power to change immigration policy has been largely upheld by the Supreme Court.
President Joe Biden has largely continued this trend and, as of this writing, has outpaced the Trump administration’s rate of action over a similar period. Among other actions, in 2021 the Biden administration made hundreds of thousands of immigrants, mainly from Venezuela, eligible for TPS, which protects recipients from deportation and allows them to work legally.
But the limits of executive action are apparent. Courts may be more willing to consider challenges to administrative changes than congressional reform. Policies enacted through agency action can similarly be rescinded through agency action. Additionally, administrative changes are not tempered by the need to compromise, resulting in wide policy swings from administration to administration. In the face of more extreme executive actions such as the Trump administration’s travel bans or Biden’s effort to temporarily halt deportations, states have often taken the lead in contesting them in court, exacerbating tensions between states and the federal government.
Who Are Immigrants in the United States?
The 44.9 million immigrants in the United States make up about one-sixth of all international migrants in the world. Although the 13.7 percent foreign-born share of the overall U.S. population is near the previous U.S. peaks of 14.8 percent in 1890 and 14.7 percent in 1910, it still falls below many countries, particularly those with small populations.
Figure 2. Number and Share of Immigrants in the United States, 1850-2019
Source: MPI, “U.S. Immigrant Population and Share over Time, 1850-Present,” MPI Migration Data Hub, accessed December 9, 2021, available online.
MPI estimates approximately 45 percent of the foreign-born population are naturalized citizens, 28 percent are lawful permanent residents (LPRs, also known as green card holders), 23 percent are unauthorized immigrants, and 5 percent are temporary visitors, such as international students or seasonal workers. Among unauthorized immigrants, about 16 percent as of 2019 were temporarily protected from deportation through enrollment in TPS or DACA or because they had a pending asylum application.
Figure 3. Immigrant Population in the United States by Status, 2019
Notes: DACA is Deferred Action for Childhood Arrivals and TPS is Temporary Protected Status.
Sources: These 2019 data result from MPI analysis of data from the U.S. Census Bureau’s 2015–19 American Community Survey (ACS), pooled, and the 2008 Survey of Income and Program Participation (SIPP), weighted to 2019 unauthorized immigrant population estimates provided by Jennifer Van Hook. Data on DACA recipients are from U.S. Citizenship and Immigration Services (USCIS), “Approximate Active DACA Recipients: As of June 30, 2019,” accessed December 8, 2021, available online. Data on TPS beneficiaries are from Jill H. Wilson, Temporary Protected Status: Overview and Current Issues (Washington, DC: Congressional Research Service, 2018), available online. Data on asylum seekers are from USCIS, “Form I-765 Application for Employment Authorization, All Receipts, Approvals, Denials Grouped by Eligibility Category and Filing Type,” accessed December 8, 2021, available online.
Roughly 10.9 million (24 percent) of the immigrant population is from Mexico, the most common country of origin. However, since 2013 new arrivals from India and China have outpaced those from Mexico, due to factors including the large numbers of Indian and Chinese migrants who are international students or hold temporary work visas, as well as reduced illegal immigration from Mexico following the 2008 financial crisis, a growing economy there, and increased U.S. border enforcement. Latin America is the largest region of origin for the overall U.S. immigrant population; the Pew Research Center has projected that immigrants from Asia will make up the largest share of the foreign-born population by 2065. Overall, Indian and Chinese immigrants make up the second- and third-largest immigrant groups, with 2.7 million and 2.5 million respectively, or about 6 percent of the foreign-born population each.
Immigrants are geographically concentrated, with 63 percent residing in six states that have long been the main immigrant destinations: California (about 24 percent of the overall U.S. foreign-born population), Texas (11 percent), Florida and New York (each with 10 percent), New Jersey (5 percent), and Illinois (4 percent). While these states continue to draw the bulk of the foreign-born population, newcomers—particularly unauthorized immigrants from Mexico—have also settled elsewhere in recent decades, following employment opportunities, especially in agriculture, food manufacturing, and construction. Ten states have experienced a more than 350 percent increase in their immigrant populations since 1990: North Carolina, Tennessee, Georgia, Arkansas, Nevada, South Carolina, Kentucky, Nebraska, South Dakota, and Utah. In four of these states, immigrant populations have more than quintupled. Arrivals of immigrants in new regions may help explain why immigration has become a more salient national political issue.
New migration patterns may also make integration more difficult, as local infrastructure may not exist to accommodate non-English speakers or those from other cultures. Additionally, areas that experience sudden foreign-born population growth are prone to implement more restrictive local policies toward immigrants. Nationally, researchers have found that migrants’ sense of belonging may grow when they reach certain milestones such as language proficiency and citizenship. According to the International Social Survey Program’s National Identity module, immigrants’ sense of belonging in the United States decreased from 2003 to 2013, but even still was higher than many other “settler nations” such as in Western Europe. It is possible that this sense of belonging has deteriorated as restrictionist viewpoints and policies have entered the mainstream in recent years. Between 2014 and 2019, the United States dropped in the Migrant Integration Policy Index, which tracks public policies affecting immigrant integration, from a score of 75 out of 100 to 73 (meanwhile, the average country score increased by two points in the same period).
Still, Gallup reports the share of Americans who say immigration is good for the country has increased from 62 percent in 2001 to 77 percent in 2020, also the first year more people said immigration should increase than decrease (34 percent versus 28 percent). Most of the increase in those supporting higher levels of immigration comes from Democrats and independents, but shows that explicitly pro-immigration sentiment has risen alongside skepticism.
How Does the U.S. Immigration System Work?
The modern U.S. immigration system was largely established in 1965 and allows for arrival through three primary streams: (re)unification for U.S. citizens and LPRs with close family members, employment, and humanitarian protection. Typically, about two-thirds of permanent immigrants arrive through family-based channels, with about 14-15 percent through employment pathways, and the remainder divided among humanitarian migrants, Diversity Visa recipients, and others such as Afghans and Iraqis who worked with the U.S. government. Other migrants come to the United States temporarily as short-term workers or international students, among others.
For more details on how these visas are allocated, see MPI’s explainer on the legal immigration system.
Figure 4. Green Cards Issued by Category, FY 2019
Source: U.S. Department of Homeland Security (DHS), “Table 7. Persons Obtaining Lawful Permanent Resident Status by Type and Detailed Class of Admission: Fiscal Year 2019,” updated January 26, 2021, available online.
Family Pathways
In FY 2019, the 710,000 immigrants admitted via family sponsorship made up 69 percent of the 1 million green cards issued that year. There are huge backlogs in all visa categories, including 3.8 million family applications at the end of 2020. Family-based migration makes up such a large share of overall immigration because immediate relatives of U.S. citizens—including spouses, children under age 21, and parents—are exempted from the yearly cap of 226,000 family-based green cards. But the waits for other categories of relatives can be grueling and sometimes impossible; as of this writing, a Mexican national being sponsored for a green card by a U.S.-citizen sibling faces a wait of more than 150 years.
Employment-Based Channels
Of the green cards issued in FY 2019, 139,000 (14 percent) were issued through employer sponsorship. As has been the case for decades, most of these new LPRs had already been living in the United States on a temporary work visa. Because of lengthy backlogs, particularly for nationals of countries such as India, many had been waiting years to have their application adjudicated.
Because just 140,000 employment-based green cards can be issued each year and more than half tend to go to principal applicants’ spouses and children, the demand greatly outpaces the supply. This is partly because more workers are coming on temporary visas and hope to stay in the United States. For example, more than 389,000 petitions for H-1B visas for temporary high-skilled workers were approved in FY 2019, up from nearly 258,000 in FY 2000. More international students have been granted work authorization for Optional Practical Training (OPT), which allows them to work in the country for one to two years after graduating from a U.S. institution: the 156,000 initial employment authorization documents granted under OPT in FY 2019 were more than twice the 75,000 granted in FY 2003.
Issuance of temporary work visas such as the H-2A visa for seasonal agricultural work and the H-2B visa for seasonal nonagricultural work has also risen in recent years. The 29,000 agricultural work visas issued in FY 1999 rose to 205,000 in FY 2019. In the past decade, agricultural employers who historically relied on a largely unauthorized immigrant workforce have turned to the H-2A visa. Issuances of H-2B visas have also multiplied, from 31,000 issued in FY 1999 to 98,000 in FY 2019. Although H-2B issuances are capped at 66,000 annually, Congress has repeatedly allowed DHS to temporarily raise that cap to meet demand.
Refugees and Asylum Seekers
To qualify as a refugee or asylee, one must demonstrate fear of persecution in their native country because of race, religion, nationality, political opinion, or membership in a particular social group. Refugees apply from another country and then are resettled in the United States, while asylees apply from within the United States.
From the 1970s through the mid-1990s, more than 100,000 refugees were admitted during some years, typically from Southeast Asia and countries in the former Soviet Union (see Figure 6). Since then, refugee admissions have decreased and their principal regions of origin have shifted to the Middle East and Africa.
Figure 5. Refugee Arrivals by Region of Origin, FY 1975-2021
Sources: U.S. Refugee Processing Center, “Admissions & Arrivals—Refugee Admissions Report as of October 31, 2021,” updated October 31, 2021, available online; Andorra Bruno, Refugee Admissions and Resettlement Policy (Washington, DC: Congressional Research Service, 2018), available online.
The United States has historically led the world in numbers of refugees resettled annually, but there were major dips following the September 11, 2001, terrorist attacks and after Trump became president in 2017—a drop that has continued into the Biden administration. In FY 2021, the United States admitted the fewest refugees since the modern resettlement framework was created in 1980: 11,411.
Meanwhile, recent filings of asylum cases, largely by Central Americans, have reached heights not seen in at least three decades . Asylum cases can be filed either defensively in immigration court if the applicant is already in removal proceedings, or affirmatively with USCIS. Among cases filed defensively, top countries of origin have shifted from Mexico and China in the early 2000s to El Salvador, Guatemala, and Honduras. There are less historical data available about affirmative cases, but Venezuela notably emerged as a top country of origin among that group in 2017.
The number of asylum grants increased slightly from 2017 to 2019, but the number of denials increased even more. As a result, the asylum approval rate decreased, largely due to increased pressure on immigration judges to adjudicate cases faster and new policies narrowing asylum eligibility. New filings have outpaced adjudications, so by the end of FY 2021 there were 640,000 asylum cases pending in immigration courts and 386,000 pending at USCIS.
Illegal Flows
The population of unauthorized immigrants in the United States has been relatively stable at an estimated 11 million for the past decade, after reaching a peak of 12 million in 2007. However, its composition has changed: The number of unauthorized immigrants from Mexico dropped by more than 2 million since 2007, although Mexicans still make up about half the unauthorized population, the largest share of any nationality. Over the same period other unauthorized immigrant populations have grown, mainly from Asian countries including India, China, and the Philippines, and from El Salvador, Guatemala, and Honduras.
From 2010 to 2017, visa overstayers accounted for most of the growth in the overall unauthorized population. However, most unauthorized immigrants from Central America crossed the border illegally. Indeed, for most years since FY 2014 more migrants from El Salvador, Guatemala, and Honduras have crossed illegally than single Mexican men seeking U.S. jobs, who had comprised the vast majority of apprehensions in previous decades. Compared to previous Mexican migrants, higher shares of Central Americans come as families and seek asylum.
Figure 6. U.S. Border Patrol Southwest Border Encounters by Nationality, FY 2000-21
Note: Data from FY 2000-06 denote encounters only of either Mexicans or non-Mexicans; subsequent data also specify arrivals from El Salvador, Guatemala, and Honduras.
Sources: Data for FY 2000-06 are from U.S. Border Patrol, “U.S. Border Patrol Apprehensions From Mexico and Other Than Mexico (FY 2000 – FY 2020),” accessed December 8, 2021, available online. Data for FY 2007-20 are from U.S. Border Patrol, “U.S. Border Patrol Nationwide Apprehensions by Citizenship and Sector,” accessed December 8, 2021, available online. Data for FY 2021 are from U.S. Customs and Border Protection, “Southwest Land Border Encounters,” updated November 15, 2021, available online.
This change has posed challenges for a U.S. border strategy designed to target illegal crossings by adults from Mexico. Criminal prosecution, expedited removal, detention, and other consequences designed for adults are more difficult to apply to families and unaccompanied children expressing fears of returning to their origin countries.
What Next? Prospects for Reform and the Future of U.S. Immigration
The nearly 60-year-old U.S. immigration system was designed in response to factors that are increasingly disconnected from current economic and demographic realities. The U.S. population is aging, with the U.S. Census Bureau estimating that seniors over age 65 will outnumber children under 18 by 2034, potentially straining pension and health-care systems. Additionally, the gap between labor demand and the skills of U.S. workers is projected to widen. Demand for lower-skill jobs in health care, hospitality, and other fields is expected to grow, but U.S. workers’ rising education levels make them less likely to fill these jobs. And the U.S. population grew by the lowest rate on record, at just 0.1 percent, in 2020.
Immigration could help solve these issues by filling certain labor-market gaps and increasing the number of workers contributing to social welfare systems.
However, heightened divisions around immigration have made addressing these issues more complex. Political tensions have created a Congress unwilling to consider most reforms in a bipartisan manner. As such, near-term action on immigration is likely to come instead from the executive branch, meaning that immigration policy will continue to change every time the White House switches between the parties. Yet this pendulum swing will still occur within the bounds of the existing legislative framework as determined by the courts, preventing a wholescale reimagining of the system that might be needed to address changing circumstances. Neither skepticism of immigration nor labor-market challenges are new issues, but the fractured nature of U.S. politics is a novel development for a country that is in so many ways defined by its immigrant history. Absent a political breakthrough, the immigration system remains an antiquated, inflexible one.
200 Years of U.S. Immigration Looks Like the Rings of a Tree
These data visualizers imagined each era of U.S. immigration as a ring in a growing tree trunk.

From policy particulars to deep questions of morality, the issue of immigration in the United States has come up with fierce urgency in recent weeks.
But today’s immigration battles take place within a long, slowly accruing history that is difficult to grasp in its sheer scale and complexity. Tens of millions of people who represent every corner of the globe have immigrated to the U.S. over the last two centuries. The picture that emerges over time can resembles a living organism, which inspired this graphic.
Trees’ annual growth rings reflect varying environmental conditions, and these forms are not perfect circles or ellipses. The algorithm for this immigration graphic is inspired by the regular shifts and irregular shapes of these natural organisms.
Like countries, trees can be hundreds, even thousands, of years old. Cells grow slowly, and the pattern of growth influences the shape of the trunk. Just as these cells leave an informational mark in the tree, so too do incoming immigrants contribute to the country’s shape.
These immigration “rings” expand during years when certain welcoming factors are prevalent, such as when American immigration policies become less restrictive and its economy offers greater opportunity. The “rings” tend to stay slim during years of war or economic upheaval.
The origins of U.S. immigrant populations also transform from era to era. In the 1840s and 1880s, European immigrants came mainly from northern and western Europe, whereas the famous influx of the early 1900s, symbolized by Ellis Island’s gateway, emanated mostly from southern and eastern Europe. Immigration from Asia rose between 1970 and 2000, while large-scale immigration from Latin America began in 1950 and lasted for half a century. Immigration from Africa only becomes visible in the 21st century, though early U.S. Census data omits populations of slaves and indigenous communities.
History of immigration to the United States
The history of immigration to the United States details the movement of people to the United States, from the colonial era to the present. The United States experienced successive waves of immigration, particularly from Europe, and later from Asia and Latin America. Colonial era immigrants often repaid the cost of transoceanic transportation by becoming indentured servants where the new employer paid the ship’s captain. Starting in the late 19th century immigration was restricted from China and Japan. In the 1920s restrictive immigration quotas were imposed, although political refugees had special status. Numerical restrictions ended in 1965. In recent years the largest numbers have come from Asia and Central America.
Attitudes towards new immigrants have cycled between favorable and hostile since the 1790s. Recent debates focus on the Southern border, and on the status of “dreamers” who have lived almost their entire life in the U.S. after being brought in without papers as children.
Colonial era
In 1607 the first successful English colony settled in Jamestown, Virginia. Once tobacco was found to be a profitable cash crop, many plantations were established along the Chesapeake Bay in Virginia and Maryland.
Thus began the first and longest era of immigration, lasting until the American Revolution in 1775; during this time settlements grew from initial English toe-holds from the New World to British America. It brought Northern European immigrants, primarily of British, German, and Dutch extraction. The British ruled from the mid-17th century and they were by far the largest group of arrivals, remaining within the British Empire. Over 90% of these early immigrants became farmers.
Large numbers of young men and women came alone as indentured servants. Their passage was paid by employers in the colonies who needed help on the farms or in shops. Indentured servants were provided food, housing, clothing and training but they did not receive wages. At the end of the indenture (usually around age 21, or after a service of seven years) they were free to marry and start their own farms.
New England
Seeking religious freedom in the New World, one hundred English Pilgrims established a small settlement near Plymouth, Massachusetts in 1620. Tens of thousands of English Puritans arrived, mostly from the East Anglian parts of England (Norfolk, Suffolk, East Sussex., and settled in Boston, Massachusetts and adjacent areas from around 1629 to 1640 to create a land dedicated to their religion. The earliest New English colonies, Massachusetts, Connecticut, Rhode Island, and New Hampshire, were established along the northeast coast. Large scale immigration to this region ended before 1700, though a small but steady trickle of later arrivals continued.
The New English colonists were the most urban and educated of all their contemporaries, and they had many skilled farmers, tradesmen and craftsmen among them. They started the first university, Harvard, in 1635 in order to train their ministers. They mostly settled in small villages for mutual support (nearly all of them had their own militias) and common religious activities. Shipbuilding, commerce, agriculture, and fishing were their main sources of income. New England’s healthy climate (the cold winters killed the mosquitoes and other disease-bearing insects), small widespread villages (minimizing the spread of disease), and an abundant food supply resulted in the lowest death rate and the highest birth rate of any of the colonies. The Eastern and Northern frontier around the initial New England settlements was mainly settled by the descendants of the original New Englanders. Immigration to the New England colonies after 1640 and the start of the English Civil War decreased to less than 1% (about equal to the death rate) in nearly all of the years prior to 1845. The rapid growth of the New England colonies (approximately 900,000 by 1790) was almost entirely due to the high birth rate (>3%) and the low death rate (<1%) per year.
Dutch
The Dutch colonies, organized by the United East Indian Company, were first established along the Hudson River in present-day New York state starting about 1626. Wealthy Dutch patroons set up large landed estates along the Hudson River and brought in farmers who became renters. Others established rich trading posts to trade with Native Americans and started cities such as New Amsterdam (now New York City) and Albany, New York. After the British seized the colony and renamed it New York, Germans (from the Palatinate), and Yankees (from New England) began arriving.
Middle colonies
Maryland, New York, New Jersey, Pennsylvania, and Delaware formed the middle colonies. Pennsylvania was settled by Quakers from Britain, followed by Ulster Scots (Northern Ireland) on the frontier and numerous German Protestant sects, including the German Palatines. The earlier colony of New Sweden had small settlements on the lower Delaware River, with immigrants of Swedes and Finns. These colonies were absorbed by 1676.
The middle colonies were scattered west of New York City (established 1626; taken over by the English in 1664) and Philadelphia, Pennsylvania (established 1682). New Amsterdam/New York had the most diverse residents from different nations and prospered as a major trading and commercial center after about 1700. From around 1680 to 1725, Pennsylvania was controlled by the Quakers. The commercial center of Philadelphia was run mostly by prosperous Quakers, supplemented by many small farming and trading communities, with a strong German contingent located in villages in the Delaware River valley.
Starting around 1680, when Pennsylvania was founded, many more settlers arrived to the middle colonies. Many Protestant sects were attracted by freedom of religion and good, cheap land. They were about 60% British and 33% German. By 1780, New York’s population were around 27% descendants of Dutch settlers, about 6% were African, and the remainder were mostly English with a wide mixture of other Europeans. New Jersey, and Delaware had a British majority, with 7–11% German-descendants, about 6% African population, and a small contingent of the Swedish descendants of New Sweden.
Frontier
The fourth major center of settlement was the western frontier, located in the inland parts of Pennsylvania and south colonies. It was mainly settled from about 1717 to 1775 by Presbyterian farmers from North England border lands, Scotland, and Ulster, fleeing hard times and religious persecution. Between 250,000 and 400,000 Scots-Irish migrated to America in the 18th century. The Scots-Irish soon became the dominant culture of the Appalachians from Pennsylvania to Georgia. Areas where 20th century censuses reported mostly ‘American‘ ancestry were the places where, historically, northern English, Scottish and Scots-Irish Protestants settled: in the interior of the South, and the Appalachian region. Scots-Irish American immigrants, were made up of people from the southernmost counties of Scotland who had initially settled in Ireland. They were heavily Presbyterian, and largely self-sufficient. The Scots-Irish arrived in large numbers during the early 18th century and they often preferred to settle in the back country and the frontier from Pennsylvania to Georgia, where they mingled with second generation and later English settlers. They enjoyed the very cheap land and independence from established governments common to frontier settlements.
Southern colonies
The mostly agricultural Southern English colonies initially had very high death rates for new settlers due to malaria, yellow fever, and other diseases as well as skirmishes with Native Americans. Despite this, a steady flow of new immigrants, mostly from Central England and the London area, kept up population growth. As early as 1630, initial areas of settlement had been largely cleared of Native Americans by major outbreaks of measles, smallpox, and bubonic plague beginning already decades before European settlers began arriving in large numbers. The leading killer was smallpox, which arrived in the New World around 1510–1530.
Initially, the plantations established in these colonies were mostly owned by friends (mostly minor aristocrats and gentry) of the British-appointed governors. A group of Gaelic-speaking Scottish Highlanders created a settlement at Cape Fear in North Carolina, which remained culturally distinct until the mid-18th century, at which point it was swallowed up by the dominant English-origin culture. Many settlers from Europe arrived as indentured servants, having had their passage paid for, in return for five to seven years of work, including free room and board, clothing, and training, but without cash wages. After their periods of indenture expired, many of these former servants founded small farms on the frontier.
By the early 18th century, the involuntary migration of African slaves was a significant component of the immigrant population in the Southern colonies. Between 1700 and 1740, a large majority of the net overseas migration to these colonies were Africans. In the third quarter of the 18th century, the population of that region amounted to roughly 55% British, 38% black, and 7% German. In 1790, 42% of the population in South Carolina and Georgia was of African origin. Before 1800, the growing of tobacco, rice and indigo in plantations in the Southern colonies relied heavily on the labor of slaves from Africa. The Atlantic slave trade to mainland North America stopped during the Revolution and was outlawed in most states by 1800 and the entire nation in 1808 Act Prohibiting Importation of Slaves, although some slaves continued to be smuggled in illegally.
Characteristics
While the thirteen colonies differed in how they were settled and by whom, they had many similarities. Nearly all were settled and financed by privately organized British settlers or families using free enterprise without any significant Royal or Parliamentary government support. Nearly all commercial activity comprised small, privately owned businesses with good credit both in America and in England, which was essential since they were often cash poor. Most settlements were largely independent of British trade, since they grew or manufactured nearly everything they needed; the average cost of imports per household was 5–15 pounds sterling per year. Most settlements consisted of complete family groups with several generations present. The population was rural, with close to 80% owning the land on which they lived and farmed. After 1700, as the Industrial Revolution progressed, more of the population started to move to cities, as had happened in Britain. Initially, the Dutch and German settlers spoke languages brought over from Europe, but English was the main language of commerce. Governments and laws mainly copied English models. The only major British institution to be abandoned was the aristocracy, which was almost totally absent. The settlers generally established their own law-courts and popularly elected governments. This self-ruling pattern became so ingrained that for the next 200 years almost all new settlements had their own government up and running shortly after arrival.
After the colonies were established, their population growth comprised almost entirely organic growth, with foreign-born immigrant populations rarely exceeding 10%. The last significant colonies to be settled primarily by immigrants were Pennsylvania (post-1680s), the Carolinas (post-1663), and Georgia (post-1732). Even here, the immigrants came mostly from England and Scotland, with the exception of Pennsylvania’s large Germanic contingent. Elsewhere, internal American migration from other colonies provided nearly all of the settlers for each new colony or state. Populations grew by about 80% over a 20-year period, at a “natural” annual growth rate of 3%.
Over half of all new British immigrants in the South initially arrived as indentured servants, mostly poor young people who could not find work in England nor afford passage to America. In addition, about 60,000 British convicts guilty of minor offences were transported to the British colonies in the 18th century, with the “serious” criminals generally having been executed. Ironically, these convicts are often the only immigrants with nearly complete immigration records, as other immigrants typically arrived with few or no records.
Other colonies
Spanish
Although Spain set up a few forts in Florida, notably San Agustín (present-day Saint Augustine) in 1565, they sent few settlers to Florida. Spaniards moving north from Mexico founded the San Juan on the Rio Grande in 1598 and Santa Fe, New Mexico in 1607–1608. The settlers were forced to leave temporarily for 12 years (1680–1692) by the Pueblo Revolt before returning.
Spanish Texas lasted from 1690 to 1821, when Texas was governed as a colony that was separate from New Spain. In 1731, Canary Islanders (or “Isleños”) arrived to establish San Antonio. The majority of the few hundred Texan and New Mexican colonizers in the Spanish colonial period were Spaniards and criollos. California, New Mexico and Arizona all had Spanish settlements. In 1781, Spanish settlers founded Los Angeles.
At the time the former Spanish colonies joined the United States, Californios in California numbered about 10,000 and Tejanos in Texas about 4,000. New Mexico had 47,000 Spanish settlers in 1842; Arizona was only thinly settled.
However, not all these settlers were of European descent. As in the rest of the American colonies, new settlements were based on the casta system, and although all could speak Spanish, it was a melting pot of whites, Natives and mestizos.
French
In the late 17th century, French expeditions established a foothold on the Saint Lawrence River, Mississippi River and Gulf Coast. Interior trading posts, forts and cities were thinly spread. The city of Detroit was the third-largest settlement in New France. New Orleans expanded when several thousand French-speaking refugees from the region of Acadia made their way to Louisiana following British expulsion, settling largely in the Southwest Louisiana region now called Acadiana. Their descendants are now called Cajun and still dominate the coastal areas. About 7,000 French-speaking immigrants settled in Louisiana during the 18th century.
Population in 1790
The following were the countries of origin for new arrivals to the United States before 1790.[23] The regions marked with an asterisk were part of Great Britain. The ancestry of the 3.9 million population in 1790 has been estimated by various sources by sampling last names from the 1790 census and assigning them a country of origin. The Irish in the 1790 census were mostly Scots-Irish. The French were primarily Huguenots. The total U.S. Catholic population in 1790 was probably less than 5%. The Native American population inside territorial U.S. boundaries was less than 100,000.
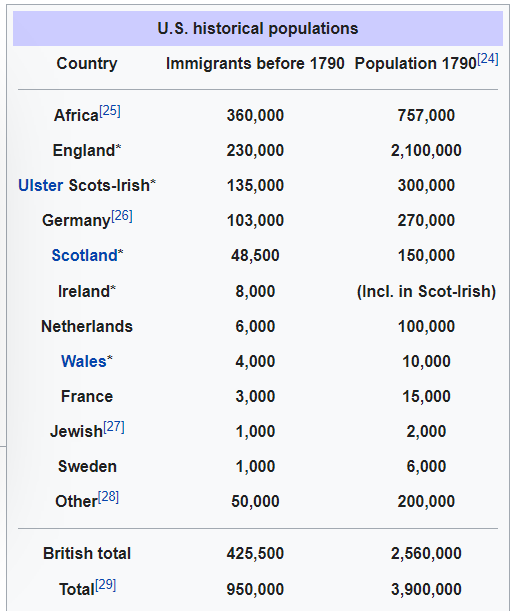
The 1790 population reflected the loss of approximately 46,000 Loyalists, or “Tories”, who immigrated to Canada at the end of the American Revolution, 10,000 who went to England and 6,000 to the Caribbean.
The 1790 census recorded 3.9 million inhabitants (not counting American Indians). Of the total white population of just under 3.2 million in 1790, approximately 86% was of British ancestry (60%, or 1.9 million, English, 4.3% Welsh, 5.4% Scots, 5.8% Irish (South) and 10.5% Scots-Irish. Among those whose ancestry was from outside of British Isles, Germans were 9%, Dutch 3.4%, French 2.1% and Swedish 0.25%; blacks made up 19.3% (or 762,000) of the U.S. population. The number of Scots was 200,000; Irish and Scot-Irish 625,000. The overwhelming majority of Southern Irish were Protestant, as there were only 60,000 Catholics in the United States in 1790, 1.6% of the population. Many U.S. Catholics were descendants of English Catholic settlers in the 17th century; the rest were Irish, German and some Acadians who remained. In this era, the population roughly doubled every 23 years, mostly due to natural increase. Relentless population expansion pushed the U.S. frontier to the Pacific by 1848. Most immigrants came long distances to settle in the United States. However, many Irish left Canada for the United States in the 1840s. French Canadians who moved south from Quebec after 1860, and the Mexicans who came north after 1911, found it easier to move back and forth.
1790 to 1860s
If one excludes enslaved Africans, there was relatively little immigration from 1770 to 1830; while there was significant emigration from the U.S. to Canada, including about 75,000 Loyalists as well as Germans and others looking for better farmland in what is now Ontario. Large-scale immigration in the 1830s to 1850s came from Britain, Ireland, Germany. Most were attracted by the cheap farmland. Some were artisans and skilled factory workers attracted by the first stage of industrialization. The Irish Catholics were primarily unskilled workers who built a majority of the canals and railroads, settling in urban areas. Many Irish went to the emerging textile mill towns of the Northeast, while others became longshoremen in the growing Atlantic and Gulf port cities. Half the Germans headed to farms, especially in the Midwest (with some to Texas), while the other half became craftsmen in urban areas.
Nativism took the form of political anti-Catholicism directed mostly at the Irish (as well as Germans). It became important briefly in the mid-1850s in the guise of the Know Nothing party. Most of the Catholics and German Lutherans became Democrats, and most of the other Protestants joined the new Republican Party. During the Civil War, ethnic communities supported the war and produced large numbers of soldiers on both sides. Riots broke out in New York City and other Irish and German strongholds in 1863 when a draft was instituted, particularly in light of the provision exempting those who could afford payment.
Immigration totaled 8,385 in 1820, with immigration totals gradually increasing to 23,322 by the year 1830; for the 1820s decade immigration more than doubled to 143,000. Between 1831 and 1840, immigration more than quadrupled to a total of 599,000. These included about 207,000 Irish, starting to emigrate in large numbers following Britain’s easing of travel restrictions, and about 152,000 Germans, 76,000 British, and 46,000 French, constituting the next largest immigrant groups of the decade.
Between 1841 and 1850, immigration nearly tripled again, totaling 1,713,000 immigrants, including at least 781,000 Irish, 435,000 Germans, 267,000 British, and 77,000 French. The Irish, driven by the Great Famine (1845–1849), emigrated directly from their homeland to escape poverty and death. The failed revolutions of 1848 brought many intellectuals and activists to exile in the U.S. Bad times and poor conditions in Europe drove people out, while land, relatives, freedom, opportunity, and jobs in the US lured them in.
Starting in 1820, some federal records, including ship passenger lists, were kept for immigration purposes, and a gradual increase in immigration was recorded; more complete immigration records provide data on immigration after 1830. Though conducted since 1790, the census of 1850 was the first in which place of birth was asked specifically. The foreign-born population in the U.S. likely reached its minimum around 1815, at approximately 100,000 or 1% of the population. By 1815, most of the immigrants who arrived before the American Revolution had died, and there had been almost no new immigration thereafter.
Nearly all population growth up to 1830 was by internal increase; around 98% of the population was native-born. By 1850, this shifted to about 90% native-born. The first significant Catholic immigration started in the mid-1840s, shifting the population from about 95% Protestant down to about 90% by 1850.
In 1848, the Treaty of Guadalupe Hidalgo, concluding the Mexican War, extended U.S. citizenship to approximately 60,000 Mexican residents of the New Mexico Territory and 10,000 living in Mexican California. An additional approximate 2,500 foreign-born California residents also became U.S. citizens.
In 1849, the California Gold Rush attracted 100,000 would-be miners from the Eastern U.S., Latin America, China, Australia, and Europe. California became a state in 1850 with a population of about 90,000.

1850 to 1930
“From the Old to the New World” shows German emigrants boarding a steamer in Hamburg and arriving in New York. Harper’s Weekly, (New York) November 7, 1874
Demography
Between 1850 and 1930, about 5 million Germans migrated to the United States, peaking between 1881 and 1885 when a million Germans settled primarily in the Midwest. Between 1820 and 1930, 3.5 million British and 4.5 million Irish entered America. Before 1845, most Irish immigrants were Protestants. After 1845, Irish Catholics began arriving in large numbers, largely driven by the Great Famine.
After 1880, larger steam-powered oceangoing ships replaced sailing ships, which resulted in lower fares and greater immigrant mobility. In addition, the expansion of a railroad system in Europe made it easier for people to reach oceanic ports to board ships. Meanwhile, farming improvements in Southern Europe and the Russian Empire created surplus labor. Young people between the ages of 15 to 30 were predominant among newcomers. This wave of migration, constituting the third episode in the history of U.S. immigration, may be better referred to as a flood of immigrants, as nearly 25 million Europeans made the long trip. Italians, Greeks, Hungarians, Poles, and others speaking Slavic languages made up the bulk of this migration. 2.5 to 4 million Jews were among them.
Destinations
Film by Edison Studios showing immigrants disembarking from the steam ferryboat William Myers onto Ellis Island on July 9, 1903.
Each group evinced a distinctive migration pattern in terms of the gender balance within the migratory pool, the permanence of their migration, their literacy rates, the balance between adults and children, and the like. But they shared one overarching characteristic: they flocked to urban destinations and made up the bulk of the U.S. industrial labor pool, making possible the emergence of such industries as steel, coal, automotive, textile, and garment production, enabling the United States to leap into the front ranks of the world’s economic giants.
Their urban destinations, numbers, and perhaps an antipathy towards foreigners, led to the emergence of the second wave of organized xenophobia. By the 1890s, many Americans, particularly from the ranks of the well-off, white, and native-born, considered immigration to pose a serious danger to the nation’s health and security. In 1893 a group formed the Immigration Restriction League, and it, along with other similarly inclined organizations, began to press Congress for severe curtailment of foreign immigration.
Irish and German Catholic immigration was opposed in the 1850s by the Nativist/Know Nothing movement, originating in New York in 1843 as the American Republican Party (not to be confused with the modern Republican Party). It was empowered by popular fears that the country was being overwhelmed by Catholic immigrants, who were often regarded as hostile to American values and controlled by the Pope in Rome. Active mainly from 1854 to 1856, it strove to curb immigration and naturalization, though its efforts met with little success. There were few prominent leaders, and the largely middle-class and Protestant membership fragmented over the issue of slavery, most often joining the Republican Party by the time of the 1860 presidential election.
European immigrants joined the Union Army in large numbers, including 177,000 born in Germany and 144,000 born in Ireland, a full 16% of the Union Army. Many Germans could see the parallels between slavery and serfdom in the old fatherland.
Between 1840 and 1930, about 900,000 French Canadians left Quebec in order to immigrate to the United States and work mainly in New England. About half returned. Considering the fact that the population of Quebec was only 892,061 in 1851, this was a massive exodus. 13.6 million Americans claimed to have French ancestry in the 1980 census. A large portion of them have ancestors who emigrated from French Canada, since immigration from France was low throughout the history of the United States. The communities established by these immigrants became known as Little Canada.
Shortly after the U.S. Civil War, some states started to pass their own immigration laws, which prompted the U.S. Supreme Court to rule in 1875 that immigration was a federal responsibility.[38] In 1875, the nation passed its first immigration law, the Page Act of 1875, also known as the Asian Exclusion Act, outlawing the importation of Asian contract laborers, any Asian woman who would engage in prostitution, and all people considered to be convicts in their own countries.
In 1882 Congress passed the Chinese Exclusion Act. By excluding all Chinese laborers from entering the country, the Chinese Exclusion Act severely curtailed the number of immigrants of Chinese descent allowed into the United States for 10 years. The law was renewed in 1892 and 1902. During this period, Chinese migrants illegally entered the United States through the loosely guarded U.S.-Canadian border.
Prior to 1890, the individual states, rather than the Federal government, regulated immigration into the United States. The Immigration Act of 1891 established a Commissioner of Immigration in the Treasury Department. The Canadian Agreement of 1894 extended U.S. immigration restrictions to Canadian ports.
Late 19th Century broadside advertisement offering cheap farm land to immigrants; few went to Texas after 1860.
The Dillingham Commission was set up by Congress in 1907 to investigate the effects of immigration on the country. The Commission’s 40-volume analysis of immigration during the previous three decades led it to conclude that the major source of immigration had shifted from Central, Northern, and Western Europeans to Southern Europeans and Russians. It was, however, apt to make generalizations about regional groups that were subjective and failed to differentiate between distinct cultural attributes.
The 1910s marked the high point of Italian immigration to the United States. Over two million Italians immigrated in those years, with a total of 5.3 million between 1880 and 1920. About half returned to Italy, after working an average of five years in the U.S.
In this Rosh Hashana greeting card from the early 1900s, Russian Jews, packs in hand, gaze at the American relatives beckoning them to the United States. Over two million Jews fled the pogroms of the Russian Empire to the safety of the U.S. from 1881 to 1924.
Mulberry Street, along which Manhattan’s Little Italy is centered. Lower East Side, circa 1900.
Over two million Central Europeans, mainly Catholics and Jews, immigrated between 1880 and 1924. People of Polish ancestry are the largest Central European ancestry group in the United States after Germans. Immigration of Eastern Orthodox ethnic groups was much lower.
Lebanese and Syrian immigrants started to settle in large numbers in the late 19th and early 20th centuries. The vast majority of the immigrants from Lebanon and Syria were Christians, but smaller numbers of Jews, Muslims, and Druze also settled. Many lived in New York City’s Little Syria and in Boston. In the 1920s and 1930s, a large number of these immigrants set out West, with Detroit getting a large number of Middle Eastern immigrants, as well as many Midwestern areas where the Arabs worked as farmers.
Congress passed a literacy requirement in 1917 to curb the influx of low-skilled immigrants from entering the country.
Congress passed the Emergency Quota Act in 1921, followed by the Immigration Act of 1924, which supplanted earlier acts to effectively ban all immigration from Asia and set quotas for the Eastern Hemisphere so that no more than 2% of nationalities as represented in the 1890 census were allowed to immigrate to America.
New Immigration
The Sunday magazine of the New York World appealed to Immigrants with this 1906 cover page celebrating their arrival at Ellis Island.
“New immigration” was a term from the late 1880s that refers to the influx of Catholic and Jewish immigrants from southern and eastern Europe (areas that previously sent few immigrants).[50] The great majority came through Ellis Island in New York, thus making the Northeast a major target of settlement. However there were a few efforts, such as the Galveston Movement, to redirect immigrants to other ports and disperse some of the settlement to other areas of the country.
Nativists feared the new arrivals lacked the political, social, and occupational skills needed to successfully assimilate into American culture. This raised the issue of whether the U.S. was still a “melting pot,” or if it had just become a “dumping ground,” and many old-stock Americans worried about negative effects on the economy, politics, and culture. major proposal was to impose a literacy test, whereby applicants had to be able to read and write in their own language before they were admitted. In Southern and Eastern Europe, literacy was low because the governments did not invest in schools.
Thanks to immigration Catholicism became the largest denomination. St. John Cantius, one of Chicago’s “Polish Cathedrals” was one of the churches these new immigrants built despite their poverty.
1920 to 2000
Restriction proceeded piecemeal over the course of the late 19th and early 20th centuries, but immediately after the end of World War I (1914–18) and into the early 1920s, Congress changed the nation’s basic policy about immigration. The National Origins Formula of 1921 (and its final form in 1924) not only restricted the number of immigrants who might enter the United States but also assigned slots according to quotas based on national origins. The bill was so limiting that the number of immigrants coming to the U.S. between 1921 and 1922 decreased by nearly 500,000. A complicated piece of legislation, it essentially gave preference to immigrants from Central, Northern, and Western Europe, limiting the numbers from Eastern Europe and Southern Europe, and gave zero quotas to Asia. However close family members could come.
The legislation excluded Latin America from the quota system. Immigrants could and did move quite freely from Mexico, the Caribbean (including Jamaica, Barbados, and Haiti), and other parts of Central and South America.
The era of the 1924 legislation, lasted until 1965. During those 40 years, the United States began to admit, case by case, limited numbers of refugees. Jewish refugees from Nazi Germany before World War II, Jewish Holocaust survivors after the war, non-Jewish displaced persons fleeing Communist rule in Central Europe and the Soviet Union, Hungarians seeking refuge after their failed uprising in 1956, and Cubans after the 1960 revolution managed to find haven in the United States when their plight moved the collective conscience of America, but the basic immigration law remained in place.
Equal Nationality Act of 1934
This law allowed foreign-born children of American mothers and alien fathers who had entered America before the age of 18 and had lived in America for five years to apply for American citizenship for the first time. It also made the naturalization process quicker for the alien husbands of American wives. This law equalized expatriation, immigration, naturalization, and repatriation between women and men. However, it was not applied retroactively, and was modified by later laws, such as the Nationality Act of 1940.
Filipino immigration
In 1934, the Tydings–McDuffie Act provided independence of the Philippines on July 4, 1946. Until 1965, national origin quotas strictly limited immigration from the Philippines. In 1965, after revision of the immigration law, significant Filipino immigration began, totaling 1,728,000 by 2004.
Postwar immigration
In 1945, the War Brides Act allowed foreign-born wives of U.S. citizens who had served in the U.S. Armed Forces to immigrate to the United States. In 1946, The War Brides Act was extended to include the fiancés of American soldiers. In 1946, the Luce–Celler Act extended the right to become naturalized citizens to those from the newly independent nation of The Philippines and to Asian Indians, the immigration quota being set at 100 people per year per country.
At the end of World War II, “regular” immigration almost immediately increased under the official national origins quota system as refugees from war-torn Europe began immigrating to the U.S. After the war, there were jobs for nearly everyone who wanted one, when most women employed during the war went back into the home. From 1941 to 1950, 1,035,000 people immigrated to the U.S., including 226,000 from Germany, 139,000 from the UK, 171,000 from Canada, 60,000 from Mexico, and 57,000 from Italy.
The Displaced Persons Act of 1948 finally allowed the displaced people of World War II to start immigrating.[61] Some 200,000 Europeans and 17,000 orphans displaced by World War II were initially allowed to immigrate to the United States outside of immigration quotas. President Harry S. Truman signed the first Displaced Persons (DP) act on June 25, 1948, allowing entry for 200,000 DPs, then followed with the more accommodating second DP act on June 16, 1950, allowing entry for another 200,000. This quota, including acceptance of 55,000 Volksdeutschen, required sponsorship for all immigrants. The American program was the most notoriously bureaucratic of all the DP programs and much of the humanitarian effort was undertaken by charitable organizations, such as the Lutheran World Federation as well as other ethnic groups. Along with an additional quota of 200,000 granted in 1953 and more in succeeding years, a total of nearly 600,000 refugees were allowed into the country outside the quota system, second only to Israel’s 650,000.
1950s
In 1950, after the start of the Korean War, the Internal Security Act barred admission of Communists, who might engage in activities “which would be prejudicial to the public interest, or would endanger the welfare or safety of the United States.” Significant Korean immigration began in 1965, totaling 848,000 by 2004.
The Immigration and Nationality Act of 1952 affirmed the national-origins quota system of 1924 and limited total annual immigration to one-sixth of one percent of the population of the continental United States in 1920, or 175,455. This exempted the spouses and children of U.S. citizens and people born in the Western Hemisphere from the quota. In 1953, the Refugee Relief Act extended refugee status to non-Europeans.
In 1954, Operation Wetback forced the return of thousands of illegal immigrants to Mexico.[63] Between 1944 and 1954, “the decade of the wetback,” the number of illegal immigrants coming from Mexico increased by 6,000 percent. It is estimated that before Operation Wetback got underway, more than a million workers had crossed the Rio Grande illegally. Cheap labor displaced native agricultural workers, and increased violation of labor laws and discrimination encouraged criminality, disease, and illiteracy. According to a study conducted in 1950 by the President’s Commission on Migratory Labor in Texas, the Rio Grande Valley cotton growers were paying approximately half of the wages paid elsewhere in Texas. The United States Border Patrol aided by municipal, county, state, federal authorities, and the military, began a quasi-military operation of the search and seizure of all illegal immigrants. Fanning out from the lower Rio Grande Valley, Operation Wetback moved Northward. Initially, illegal immigrants were repatriated through Presidio because the Mexican city across the border, Ojinaga, had rail connections to the interior of Mexico by which workers could be quickly moved on to Durango. The forces used by the government were relatively small, perhaps no more than 700 men, but were augmented by border patrol officials who hoped to scare illegal workers into fleeing back to Mexico. Ships became a preferred mode of transport because they carried illegal workers farther from the border than buses, trucks, or trains. It is difficult to estimate the number of illegal immigrants that left due to the operation—most voluntarily. The INS claimed as many as 1,300,000, though the number officially apprehended did not come anywhere near this total. The program was ultimately abandoned due to questions surrounding the ethics of its implementation. Citizens of Mexican descent complained of police stopping all “Mexican looking” people and utilizing extreme “police-state” methods including deportation of American-born children who were citizens by law.
The failed 1956 Hungarian Revolution, before being crushed by the Soviets, forged a temporary hole in the Iron Curtain that allowed a burst of refugees to escape, with 245,000 Hungarian families being admitted by 1960. From 1950 to 1960, the U.S. had 2,515,000 new immigrants with 477,000 arriving from Germany, 185,000 from Italy, 52,000 from the Netherlands, 203,000 from the UK, 46,000 from Japan, 300,000 from Mexico, and 377,000 from Canada.
The 1959 Cuban revolution led by Fidel Castro drove the upper and middle classes to exile, and 409,000 families immigrated to the U.S. by 1970. This was facilitated by the 1966 Cuban Adjustment Act, which gave permanent resident status to Cubans physically present in the United States for one year if they entered after January 1, 1959.
Immigration and Nationality Act of 1965 (Hart-Celler Act)[edit]
This all changed with the passage of the Immigration and Nationality Act of 1965, a by-product of the civil rights movement and one of President Lyndon Johnson’s Great Society programs. The measure had not been intended to stimulate immigration from Asia, the Middle East, Africa, and elsewhere in the developing world. Rather, by doing away with the racially-based quota system, its authors had expected that immigrants would come from “traditional” societies such as Italy, Greece, and Portugal, places subject to very small quotas in the 1924 Act. The 1965 Act replaced the quotas with preferential categories based on family relationships and job skills, giving particular preference to potential immigrants with relatives in the United States and with occupations deemed critical by the U.S. Department of Labor. After 1970, following an initial influx from European countries, immigrants from places like Korea, China, India, the Philippines, and Pakistan, as well as countries in Africa became more common.
1980s
In 1986, the Immigration Reform and Control Act (IRCA) was passed, creating, for the first time, penalties for employers who hired illegal immigrants. IRCA, as proposed in Congress, was projected to give amnesty to about 1,000,000 workers in the country illegally. In practice, amnesty for about 3,000,000 immigrants already in the United States was granted. Most were from Mexico. Legal Mexican immigrant family numbers were 2,198,000 in 1980, 4,289,000 in 1990 (includes IRCA), and 7,841,000 in 2000. Adding another 12,000,000 illegal immigrants of which about 80% are thought to be Mexicans would bring the Mexican family total to over 16,000,000—about 16% of the Mexican population.
1990s: Illegal Immigration Reform and Immigration Responsibility Act of 1996
Passed in September 1996, the Illegal Immigration Reform and Immigration Responsibility Act (IIRIRA) was a comprehensive immigration reform focused on restructuring the process for admitting or removing undocumented immigrants. Its passing helped to strengthen U.S. immigration laws, restructured immigration law enforcement, and sought to limit immigration by addressing undocumented migration. These reforms affected legal immigrants, those seeking entry into the U.S., and those living undocumented in the U.S.
IIRIRA Changes to Asylum
IIRIRA created new barriers for refugees seeking asylum in the U.S. by narrowing asylum criteria previously established in the Refugee Act of 1980. To prevent fraudulent asylum filings from people who were migrating for economic or work-related reasons, IIRIRA imposed an all-inclusive filing deadline called the “One Year Bar” to asylum. IIRIRA provided limited exceptions to this rule when an “alien demonstrates to the satisfaction of the Attorney General either the existence of changed circumstances which materially affect the applicant’s eligibility for asylum or extraordinary circumstances relating to the delay in filing the application.” IIRIRA also made the asylum process more difficult for refugees by allowing for the resettlement of refugees to third countries, “precluding appeals” to denied asylum applications, implementing higher processing fees, and having enforcement officers rather than judges determine the expedited removal of refugees.
IIRIRA and Illegal Immigration
Law enforcement under IIRIRA was strengthened to restrict unlawful immigration. The Act sought to prevent illegal immigration by expanding the number of Border Patrol agents and allowing the Attorney General to obtain resources from other federal agencies. Provisions were also made to improve infrastructure and barriers along the U.S. border area. IIRIRA also delegated law enforcement capabilities to state and local officers via 287g agreements. Illegal entry into the U.S. was made more difficult by cooperation between federal and local law enforcement, in addition to stiffening penalties for illegal entry and racketeering activities which included alien smuggling and document fraud.
IIRIRA addressed unlawful migration already present in the U.S. through enhanced tracking systems that included detecting employment eligibility and visa stay violations as well as creating counterfeit-resistant forms of identification. The Act also established the 3 and 10 year re-entry bars for immigrants who accumulated unlawful presence in the U.S. and become inadmissible upon leaving the country.
The restructuring of law enforcement contributed to an increased number of arrests, detentions, and removals of immigrants. Under IIRIRA, the mandatory detention of broad groups of immigrants occurred, including those who had legal residence status but upon removal could have their status be removed after committing violent crimes. Relief and access to federal services were also redefined for immigrants as IIRIRA reiterated the 1996 Welfare Reform Act’s tier system between citizens, legal immigrants, refugees, and illegal immigrants which determined public benefits eligibility. In addition, IIRIRA also redefined financial self-sufficiency guidelines of sponsors who previously did not have to meet an income requirement to sponsor an immigrant.
Immigration summary since 1830
The top ten birth countries of the foreign born population since 1830, according to the U.S. Census, are shown below. Blank entries mean that the country did not make it into the top ten for that census, not that there is no data from that census. The 1830 numbers are from immigration statistics as listed in the 2004 Year Book of Immigration Statistics.
• The 1830 numbers list un-naturalized foreign citizens and does not include naturalized foreign born. The 1850 census is the first census that asks for place of birth. The historical census data can be found online in the Virginia Library Geostat Center. Population numbers are in thousands.


U.S. Immigration Timeline
Attitudes and laws around U.S. immigration have vacillated between welcoming and restrictive since the country’s beginning.
The United States has long been considered a nation of immigrants, but attitudes toward new immigrants by those who came before have vacillated over the years between welcoming and exclusionary. Thousands of years before Europeans began crossing the vast Atlantic by ship and settling en masse, the first immigrants arrived in North America from Asia. They were Native American ancestors who crossed a narrow spit of land connecting Asia to North America at least 20,000 years ago, during the last Ice Age.
By the early 1600s, communities of European immigrants dotted the Eastern seaboard, including the Spanish in Florida, the British in New England and Virginia, the Dutch in New York, and the Swedes in Delaware. Some, including the Pilgrims and Puritans, came for religious freedom. Many sought greater economic opportunities. Still others, including hundreds of thousands of enslaved Africans, arrived in America against their will.
Below are the events that have shaped the turbulent history of immigration in the United States since its birth.
White People of ‘Good Character’ Granted Citizenship
January 1776: Thomas Paine publishes a pamphlet, “Common Sense,” that argues for American independence. Most colonists consider themselves Britons, but Paine makes the case for a new American. “Europe, and not England, is the parent country of America. This new world hath been the asylum for the persecuted lovers of civil and religious liberty from every part of Europe,” he writes.
March 1790: Congress passes the first law about who should be granted U.S. citizenship. The Naturalization Act of 1790 allows any free white person of “good character,” who has been living in the United States for two years or longer, to apply for citizenship. Without citizenship, nonwhite residents are denied basic constitutional protections, including the right to vote, own property, or testify in court.
August 1790: The first U.S. census takes place. The English are the largest ethnic group among the 3.9 million people counted, though nearly one in five Americans are of African heritage.
Irish Immigrant Wave
1815: Peace is re-established between the United States and Britain after the War of 1812. Immigration from Western Europe turns from a trickle into a gush, which causes a shift in the demographics of the United States. This first major wave of immigration lasts until the Civil War.
Between 1820 and 1860, the Irish—many of them Catholic—account for an estimated one-third of all immigrants to the United States. Some 5 million German immigrants also come to the United States, many of them making their way to the Midwest to buy farms or settle in cities including Milwaukee, St. Louis and Cincinnati.
1819: Many of newcomers arrive sick or dying from their long journey across the Atlantic in cramped conditions. The immigrants overwhelm major port cities, including New York City, Boston, Philadelphia and Charleston. In response, the United States passes the Steerage Act of 1819 requiring better conditions on ships arriving to the country. The Act also calls for ship captains to submit demographic information on passengers, creating the first federal records on the ethnic composition of immigrants to the United States.https://www.history.com/player/1332253763625?autoplay=false
1849: America’s first anti-immigrant political party, the Know-Nothing Party forms, as a backlash to the increasing number of German and Irish immigrants settling in the United States.
1875: Following the Civil War, some states passed their own immigration laws. In 1875 the Supreme Court declares that it’s the responsibility of the federal government to make and enforce immigration laws.
Chinese Exclusion Act
1880: As America begins a rapid period of industrialization and urbanization, a second immigration boom begins. Between 1880 and 1920, more than 20 million immigrants arrive. The majority are from Southern, Eastern and Central Europe, including 4 million Italians and 2 million Jews. Many of them settle in major U.S. cities and work in factories.
1882: The Chinese Exclusion Act passes, which bars Chinese immigrants from entering the United States. Beginning in the 1850s, a steady flow of Chinese workers had immigrated to America.
They worked in the gold mines,and garment factories, built railroads and took agricultural jobs. Anti-Chinese sentiment grew as Chinese laborers became successful in America. Although Chinese immigrants make up only 0.002 percent of the United States population, white workers blame them for low wages.
The 1882 Act is the first in American history to place broad restrictions on certain immigrant groups.
1891: The Immigration Act of 1891 further excludes who can enter the United States, barring the immigration of polygamists, people convicted of certain crimes, and the sick or diseased. The Act also created a federal office of immigration to coordinate immigration enforcement and a corps of immigration inspectors stationed at principle ports of entry.
Ellis Island Opens
January 1892: Ellis Island, the United States’ first immigration station, opens in New York Harbor. The first immigrant processed is Annie Moore, a teenager from County Cork in Ireland. More than 12 million immigrants would enter the United States through Ellis Island between 1892 and 1954.
1907: U.S. immigration peaks, with 1.3 million people entering the country through Ellis Island alone.
February 1907: Amid prejudices in California that an influx of Japanese workers would cost white workers farming jobs and depress wages, the United States and Japan sign the Gentlemen’s Agreement. Japan agrees to limit Japanese emigration to the United States to certain categories of business and professional men. In return, President Theodore Roosevelt urges San Francisco to end the segregation of Japanese students from white students in San Francisco schools.
1910: An estimated three-quarters of New York City’s population consists of new immigrants and first-generation Americans.
New Restrictions at Start of WWI
1917: Xenophobia reaches new highs on the eve of American involvement in World War I. The Immigration Act of 1917 establishes a literacy requirement for immigrants entering the country and halts immigration from most Asian countries.
May 1924: The Immigration Act of 1924 limits the number of immigrants allowed into the United States yearly through nationality quotas. Under the new quota system, the United States issues immigration visas to 2 percent of the total number of people of each nationality in the United States at the 1890 census. The law favors immigration from Northern and Western European countries. Just three countries, Great Britain, Ireland and Germany account for 70 percent of all available visas. Immigration from Southern, Central and Eastern Europe was limited. The Act completely excludes immigrants from Asia, aside from the Philippines, at the time an American colony.

1924: In the wake of the numerical limits established by the 1924 law, illegal immigration to the United States increases. The U.S. Border Patrol is established to crack down on illegal immigrants crossing the Mexican and Canadian borders into the United States. Many of these early border crossers were Chinese and other Asian immigrants, who had been barred from entering legally.
Mexicans Fill Labor Shortages During WWII
1942: Labor shortages during World War II prompt the United States and Mexico to form the Bracero Program, which allows Mexican agricultural workers to enter the United States temporarily. The program lasts until 1964.
1948: The United States passes the nation’s first refugee and resettlement law to deal with the influx of Europeans seeking permanent residence in the United States after World War II.
1952: The McCarran-Walter Act formally ends the exclusion of Asian immigrants to the United States.
1956-1957: The United States admits roughly 38,000 immigrants from Hungary after a failed uprising against the Soviet Union. They were among the first Cold War refugees. The United States would admit over 3 million refugees during the Cold War.
1960-1962: Roughly 14,000 unaccompanied children flee Fidel Castro’s Cuba and come to the United States as part of a secret, anti-Communism program called Operation Peter Pan.
Quota System Ends
1965: The Immigration and Nationality Act overhauls the American immigration system. The Act ends the national origin quotas enacted in the 1920s which favored some racial and ethnic groups over others.
The quota system is replaced with a seven-category preference system emphasizing family reunification and skilled immigrants. Upon signing the new bill, President Lyndon B. Johnson, called the old immigration system “un-American,” and said the new bill would correct a “cruel and enduring wrong in the conduct of the American Nation.”
Over the next five years, immigration from war-torn regions of Asia, including Vietnam and Cambodia, would more than quadruple. Family reunification became a driving force in U.S. immigration.
April-October 1980: During the Mariel boatlift, roughly 125,000 Cuban refugees make a dangerous sea crossing in overcrowded boats to arrive on the Florida shore seeking political asylum.
Amnesty to Undocumented Immigrants
1986: President Ronald Reagan signs into law the Simpson-Mazzoli Act, which grants amnesty to more than 3 million immigrants living illegally in the United States.
2001: U.S. Senators Dick Durbin (D-Ill.) and Orrin Hatch (R-Utah) propose the first Development, Relief and Education of Alien Minors (DREAM) Act, which would provide a pathway to legal status for Dreamers, undocumented immigrants brought to the United States illegally by their parents as children. The bill—and subsequent iterations of it—don’t pass.https://www.history.com/player/1014791747773?autoplay=false
2012: President Barack Obama signs Deferred Action for Childhood Arrivals (DACA) which temporarily shields some Dreamers from deportation, but doesn’t provide a path to citizenship.
2017: President Donald Trump issues two executive orders aimed at curtailing travel and immigration from six majority Muslim countries (Chad, Iran, Libya, Syria, Yemen, Somalia) as well as North Korea and Venezuela. Both of these so-called Muslim travel bans are challenged in state and federal courts.
2018: In April 2018, the travel restrictions on Chad are lifted. In June 2018, the U.S. Supreme Court uphold a third version of the travel ban on the remaining seven countries.
The Know-Nothings: the United States’ first anti-immigration party
Conceived in fear and prejudice in the 1800s, the short-lived Know-Nothing Party’s intolerance toward German and Irish immigrants led to violence across the young nation.
The United States has long conceived of itself as a haven for immigrants, a place welcoming of any person, no matter their origin, to begin a new life as an American. Flying in the face of this ideal, an ugly strain of nativism has run throughout American history as evidenced by virulent anti-immigrant movements that reared up in the 1790s, 1870s, and 1920s.
Perhaps the most well-known nativist movement arose in the decades before the Civil War. The American Party, better known as the Know-Nothings, was a reflection of the troubled times confronting the young United States. The nation faced growing conflict over slavery and westward expansion, which led to dissent within the two major political parties, the Democrats and the Whigs.

In the 1830s and ’40s increasing numbers of immigrants, mostly Irish in the East and Germans in the Midwest, were settling in the United States. The Irish Potato Famine and economic instability in Germany led to an influx of nearly three million people, a great number of whom were Catholic. Native-born Protestants, mostly in urban areas, felt threatened by the new arrivals in several areas. To many Protestants, the Catholic Church represented tyranny and potential subjugation to a foreign power. On a practical level, competition for jobs increased as new laborers arrived. As anti-immigrant and anti–Roman Catholic feelings arose, nativist groups began to form in cities across the United States.
Many of these organizations played on fears that foreigners were gaining undue political influence because of the efforts of unscrupulous politicians to woo them and “steal” elections. Nativists often played on stereotypes depicting Irish and Germans as immoral drunkards and often blamed them for social ills, such as rising crime and poverty rates. Tensions sometimes ignited violence, with nativist riots breaking out during the 1840s and ’50s in New York, Baltimore, Philadelphia, Chicago, Cincinnati, and Louisville.

In May and July 1844 anti-immigrant violence rocked the City of Brotherly Love. Originating over whether Catholic children should sing Protestant hymns at school, riots exploded after nativists demonstrated against Catholics in an Irish Catholic neighborhood on May 6. The first riot lasted four days during which two Catholic churches burned and at least 14 people died. Then in July, violence erupted around a Catholic church being protected by the state militia. Nativist rioters pelted them with rocks and bottles, and the militia opened fire. After the smoke cleared hours later, some 15 to 20 people lay dead.
Rapid Rise, Fast Fall
In 1849 a secret society named the Order of the Star-Spangled Banner was organized in New York City. Members employed a cloak-and-dagger approach to their political activities; when asked about their organizations, members gave the canned answer: “I know nothing.” Outsiders used this response as a nickname, which stuck. As the Know-Nothings’ membership grew, they would shed their clandestine nature and eventually become the American Party in the 1850s.
Party members tended to come from the working classes and had a strong anti-elitist bent. Their platform sought to limit immigration and the influence of Catholicism, and they used ugly ethnic stereotypes to stir up hatred against the recent German and Irish arrivals. Under their plan, residency requirements would increase from five to 21 years before one could become a citizen. People born on foreign soil would not be able to vote or hold public office.
On a local level, the Know-Nothings had a large amount of success in a short time, electing mayors and state representatives in the late 1840s and early 1850s. After elections in 1854, they held 43 seats in the U.S. Congress. Much of this early success was due to the demise of the Whig Party, weakened by internal dissent over national issues like slavery. Some former Whigs defected to the Know-Nothings while others joined a new party, the antislavery Republicans.

Before 1855, the Know-Nothings had no centralized organization. Encouraged by their successes, they formally organized in 1855 as the American Party, after which they went into a rapid decline. The elections of 1856 were a disaster for their candidates. Their nominee for the presidency, former Whig and president Millard Fillmore, came in a distant third behind the Republicans and the victorious Democrats. The Know-Nothings lost more than 30 seats in Congress. Whatever power they had gained in the early 1850s was gone for good.
Winning elections on a national level proved more difficult for the Know-Nothings because of the complexity of the country’s problems. Until 1856, the Know-Nothings had largely been a local movement focused on a single issue. The move to the national stage revealed the fragility of their political alliances, and they tore themselves apart. After 1856, the Republicans would be the party to emerge from the political chaos of the mid-19th century. They would survive the challenges of a nation divided over the question of slavery.
As America Changes, Some Anxious Whites Feel Left Behind
Demographic shifts rippling across the nation are fueling fears that their culture and standing are under threat.
Even after the coal mines closed and the factory jobs disappeared and the businesses began taking down their signs on Broad Street, even after the population started its steady decline and the hospital was on the brink of bankruptcy, the residents of Hazleton, Pennsylvania, flocked downtown for the annual Funfest.
For years Sally Yale participated in the fall parade in a souped-up teacup salvaged from a spinning ride at the shuttered amusement park. Tricked out with smoking dry ice, it was the perfect advertisement for her gourmet coffee shop.
Yale is 53, but her angular face lights up like a child’s when she talks about Funfest. The applause from the crowd. The Hazletonians who returned for the celebration. “And the food,” Yale says, lifting her brows and rolling her eyes to mimic pure bliss. The cannoli and pierogi, the sausages and funnel cakes—treats that represented the waves of European immigrants that had settled in Hazleton’s rolling hills.
Then it all changed. Funfest, in Sally Yale’s eyes, became too scary. Too uncomfortable. To be honest … too brown. “You just know if you go to a public event, you know you are going to be outnumbered,” Yale says. “You know you’re going to be the minority, and do you want to go?”
For Yale, the answer was no.

Outnumbered is a word that came up often when I talked with white residents of this eastern Pennsylvania town. Outnumbered in the waiting room at the doctor’s office. Outnumbered at the bank. Outnumbered at the Kmart, where the cashier merrily chitchats in Spanish with Hazleton’s newer residents.
Hazleton was another former coal mining town slipping into decline until a wave of Latinos arrived. It would not be an overstatement to say a tidal wave. In 2000 Hazleton’s 23,399 residents were 95 percent non-Hispanic white and less than 5 percent Latino. By 2016 Latinos became the majority, composing 52 percent of the population, while the white share plunged to 44 percent.
“We joke about it and say we are in the minority now,” says Bob Sacco, a bartender at A&L Lounge, a tavern on a street now mainly filled with Latino-owned storefronts. “They took over the city. We joke about it all the time, but it’s more than a joke.”
That dizzying shift is an extreme manifestation of the nation’s changing demographics. The U.S. Census Bureau has projected that non-Hispanic whites will make up less than 50 percent of the population by 2044, a change that almost certainly will recast American race relations and the role and status of white Americans, who have long been a comfortable majority.
Hazleton’s experience offers a glimpse into the future as white Americans confront the end of their majority status, which often has meant that their story, their traditions, their tastes, and their cultural aesthetic were seen as being quintessentially American. This is a conversation already exploding across the country as some white Americans, in online forums and protests over the removal of Confederate monuments, react anxiously and angrily to a sense that their way of life is under threat. Those are the stories that grab headlines and trigger social media showdowns. But the shift in status—or what some are calling “the altitude adjustment”—is also playing out in much more subtle ways in classrooms, break rooms, factory floors, and shopping malls, where the future has arrived ahead of schedule. Since 2000, the minority population has grown to outnumber the population of whites who aren’t Hispanic in such counties as Suffolk in Massachusetts, Montgomery in Maryland, Mecklenburg in North Carolina, as well as counties in California, Colorado, Florida, Georgia, New Jersey, and Texas.

For decades, examining race in America meant focusing on the advancement and struggles of people of color. Under this framework, being white was simply the default. Every other race or ethnic group was “other-ized,” and matters of race were the problem and province of people of color. In a period bookended by the presidential elections of Barack Obama and Donald Trump, the question of what it means to be white in America has increasingly taken center stage.
On several fronts, there is growing evidence that race is no longer a spectator sport for white Americans: The growth of whiteness studies courses on college campuses. Battles over immigration and affirmative action. A rising death rate for middle-aged white Americans with no more than a high-school diploma from drugs, alcohol, and suicide in what economists are calling “deaths of despair.” The increasingly racially polarized electorate. The popularity of a television show called Dear White People that satirizes “post-racial” America. The debate over the history and symbols of the Confederacy. The aggression and appeal of white nationalism, with its newest menacing chant: “You will not replace us.”
The protests in Charlottesville, Virginia, last August likely will be remembered as a moment when hate groups, wearing polo shirts and khakis, stepped out of the shadows. Most Americans soundly denounce the message and the methods of the neo-Nazis, Ku Klux Klan members, and white nationalists who gathered at the “Unite the Right” rally to decry the removal of a monument honoring a Confederate general. But matters of race are complicated, and academics and researchers who closely chart the fractious history of race relations in this country note that the Charlottesville demonstrations—though widely pilloried—also punctuate an issue that animates everything from politics to job prospects and even the world of professional sports: the fear of displacement in an era of rapid change.

Just over 10 years ago, Hazleton was thrust into the national spotlight when the mayor, now U.S. congressman Lou Barletta, urged the city council to pass a first-of-its-kind ordinance called the Illegal Immigration Relief Act. It set steep penalties for those who hire or rent to undocumented immigrants. It was accompanied by an ordinance that sought to make English the official language of Hazleton. The laws were introduced amid rising cultural tension in the community, which was seeing an influx of Latinos, many moving from New York and New Jersey. Barletta said the IIRA ordinance—which included the assertion that “illegal immigration leads to higher crime rates”—was aimed at preserving a way of life in “Small Town, USA.” It never went into effect. Federal courts ruled the ordinance was preempted by U.S. immigration law. But the episode still reverberates, says Jamie Longazel, a professor at John Jay College of Criminal Justice in New York City who grew up in Hazleton and has done extensive research on the demographic changes in his hometown. Longazel said the widely publicized debate over the law amplified tensions and fed what social scientists call the “Latino threat narrative.”
“We know in sociology when community identity is challenged or questioned in some way, the community asserts and defends that identity,” Longazel says. “With Hazleton’s changing demographics and persistent economic decline, the community began to see itself as white. The city reasserted its identity as white.” Longazel thinks that same psychology might be emerging on a national level.
His research found repeated themes. White Hazletonians consistently recalled a city that was “close-knit, quiet, obedient, honest, harmless, and hardworking” and described newcomers as “loud, disobedient, manipulative, lawless, and lazy.” The anecdotes were often similar. Did that many people really witness a Latino family at the grocery store using food stamps to buy seafood and steak, or did the stories spiral forward on their own weight, embraced and repeated as personal observation? And why did so few people in his research reference the new residents who were paying taxes, going to church twice a week, buying sedans on Airport Road, and opening businesses that percolate all up and down North Wyoming Street?

In the end, trying to underscore Hazleton’s status as an all-American white enclave was akin to shaking a fist at a rain cloud. Latinos are now the driving force in Hazleton’s economy, and the city has taken on an increasingly Latin flavor. Hazleton now looks, sounds, smells, and feels transformed.
Over and over you hear longtime residents say they feel like strangers on their home turf. Yale, the coffee shop owner, has watched most of her classmates from Bishop Hafey High School leave Hazleton, mainly for better job prospects. She opted to stay and opened her gourmet coffee shop, called the Abbey, with its gleaming red espresso machine and its home-style meals. Though her café is just up a hill from downtown, she rarely ventures toward the main business district.
Yale pulled out of Funfest years ago. “Too scary,” she says. “If you do go down there, you don’t know who is carrying a gun.”
The irony is evident to Yale. Her grandfather came to Hazleton from Italy in the early 1900s and became an insurance agent and Americanized his name from Yuele to Yale. She knows the same stereotypes were hurled at Italian and Irish immigrants when they first arrived in Hazleton.

Yale is quick with a laugh and punctuates her hellos and goodbyes with bear hugs. Everything about her says cozy. She wears thick-soled tennis shoes and oversize sweatshirts. But sit with her for a spell, and it’s clear that she also has a lot of steel. It’s served her well as a single woman running a business. Once the restaurant clears out, she believes in speaking her mind.
“We have one of us in that White House,” Yale says of Trump. “We are going to make America great again.”
When asked who she means by “we,” Yale pauses. Her gaze hardens a bit. The music goes out of her voice. “The ‘we’ are the Caucasians that built this country,” she says. “Our generation. We’re going to … We’re going to make our grandfathers proud. We have to.”
For eight years I have been listening to Americans share their candid views about race and identity. While on sabbatical from National Public Radio, I started the Race Card Project, an initiative to foster honest conversation by asking people to distill their thoughts on race to just six words. That’s usually just the beginning of a deeper engagement. Tens of thousands of people have participated, often sending pictures, artifacts, and essays to share the backstory behind their six words.
I created the Race Card Project when the word “post-racial” was in vogue, but I knew America was anything but. U.S. voters had just sent a black family to the White House for the first time, and we thought the conversation was over? I suspected instead that it was time to put on our proverbial seat belts and buckle up for a bumpy ride. Most Americans had never had a black boss, and now they had a black president.
When six-word stories first started arriving in large numbers—first as postcards and eventually via digital submissions at theracecardproject.com—I assumed the bulk of the stories would come from those in the minority. I was wrong.
People from all kinds of races, faiths, regions, classes, and backgrounds have submitted stories, but since the beginning, most have come from white people. “White, not allowed to be proud.” “I’m only white when it’s convenient.” “More than just a ‘white girl.’ ” “Yes, it’s ok to be white.” “She’s nothing but poor white trash.” “Gay, but at least I’m white.” “Hated for being a white cop.” “Abuse was invisible because I’m white.” “Not as white as I appear.” “I’m white and not ashamed.” “White privilege? More like white guilt.” “We the people = We white people.” “Other races resent us White people.” “Most white people are not racists.” “White people do not own racism.” “I unpack my white privilege daily.”


White Americans are not traditionally in the foreground of this country’s conversation about race, but the Race Card Project’s archive has become a place where thousands of people have talked honestly about privilege, guilt, rage, myopia, displacement, allegiance, power, romance, or simply the world as seen through a white gaze.
“The whole notion of whiteness as we know it depends on not being a minority,” says Brian Glover, a professor who specializes in 18th-century British literature at East Carolina University in Greenville, North Carolina. “In the 20th century, the white man was the best deal that anybody ever had in the history of the planet. I mean, in America you could feel like you were at the center of everything. You didn’t have to justify yourself.”
After hearing a story about the demographic changes, Glover sent these six words to the Race Card Project in-box: “These days, I understand the WASPs.” Glover explains that he was born in the 1970s to a family of mixed European origin—Jewish, Irish, Greek, German, Slovene, people once not seen as fully white by the gatekeepers of social class. But over time they moved into the mainstream. “I definitely felt that I was a white American, which I understood to mean just plain American,” he says.
These new Americans, fueled by waves of European immigrants like Glover’s great-grandparents, were starting to displace the white Anglo-Saxon Protestants who had run the country for two centuries. In a short, candid essay he submitted to the Race Card Project, Glover wrote, “We had taken over their colleges, their clubs, and even the White House,” referring to the election of an Irish Catholic president, John F. Kennedy, in 1960.
“Well, now we’re in their shoes,” he wrote. “People of Color are moving into the mainstream now; ‘White’ is no longer the default setting for ‘American.’ And though it’s clear that this process is inevitable—it’s just a matter of numbers and demographics—a lot of the time, to be honest, I’m sad about it. The country is changing in ways that aren’t very good for me, and I’ve got no choice but to adapt. I’m not complaining; it’s only fair that other people get the same opportunity we got. But now I find myself looking back at the WASPs with new respect. Though there were many notable exceptions, for the most part during their fall from power they conducted themselves with quiet dignity. I’m sure it didn’t feel good for them at the time, but for the most part they just got on with their lives. We could learn from their example.”
Glover has been thinking a lot these days about what equality means for white Americans who enjoyed advantages they’ve never fully acknowledged having. He’s an academic who’s used to critiquing an issue from all sides, but this makes him weary. The stakes directly affect him.
“It means that a lot of people are just going to lose materially and are already losing materially,” he told me in a recent conversation. “I can somehow feel more virtuous because it was necessarily built on equality? I just don’t know if that really keeps people warm at night, knowing that there’s equality out there. I think they would rather have privilege.” He’s just being honest about the practical effect for people like him.
Although the Declaration of Independence asserts that “all men are created equal,” Glover notes that “America was founded on slavery.” He continues, “So I’m not sure that you can take the abstract principle of equality without the accompanying inequality of reality.” He knows what he’s saying is impolitic and perhaps incendiary. Through my work at the Race Card Project, I know he’s not alone in his angst. For his part Glover maintains that it’s hard for an individual—or a country—to evolve past discomfort if the source of the anxiety is only discussed in hushed tones.


HISTORY DEBATED
Frank Stewart (left), along with his wife, Paulette, is waging a fierce battle against New Orleans mayor Mitch Landrieu’s decision to remove Confederate monuments. Stewart took out newspaper ads in New Orleans accusing Landrieu (right) of destroying works of art and dividing the city racially. “I do not condone what those represented on these statues did,” the businessman wrote, “but I also cannot condone your attempts to eradicate history.”
So what happens when America crosses that milestone and becomes a majority-minority country? There won’t be any fireworks or bells, and in truth this country’s infrastructure around wealth, politics, education, and opportunity is so entrenched that white people, and white men in particular, will still hold the reins of power on Wall Street and Main Street for quite some time. The change is likely to be more subtle. You will see it at the grocery store, in the produce section and condiment aisle. You will see it in classrooms, where the under-18 population will reach a majority-minority state in just two years. You will notice it in pop culture and in advertisements, where businesses have already figured out that the color most important to their bottom line is green.
While the angst over the coming demographic shift might make for more uncomfortable race relations, it might finally usher in a reckoning in which America faces hard truths: The Founding Fathers built white dominance into the fabric and laws of the nation, and a country that proclaims to love freedom and liberty is still struggling with its roots in the original sin of slavery.
Pride and history stir up a complicated cocktail in New Orleans, where Mayor Mitch Landrieu championed the removal of Confederate monuments throughout the city, including one of Gen. Robert E. Lee, despite vociferous protests and cries of cultural displacement.
“These statues are not just stone and metal,” Landrieu said in a speech that drew widespread attention due to its eloquent call for fellow Southerners to reject a history that many hold dear. “They are not just innocent remembrances of a benign history. These monuments purposefully celebrate a fictional, sanitized Confederacy—ignoring the death, ignoring the enslavement and the terror it actually stood for.”

For some Landrieu emerged as a hero—a white Southerner willing to ask America to atone for its original sin. To others he’s become a pariah and the subject of taunts and death threats. New Orleans businessman Frank Stewart, who took out newspaper ads denouncing the removal of the monuments, said they should have been amended instead of removed. “A monument and a memorial to a wonderful leader, a general, is not a symbol of slavery and discrimination or segregation,” Stewart says. “Those monuments represent the life of people who were very significant in history, and you don’t destroy monuments. You don’t burn history books. You learn from them.”
Stewart accuses Landrieu of rewriting and erasing history and using the issue to make a national name for himself. For a country that has, in his view, moved past enslavement and Jim Crow segregation—something he calls “positive evolution”—the monuments stand as important milestones that remind New Orleans of how far the city and the country have moved forward.
For his part, Landrieu says, “we have a better argument.” He presides over a city that is 59 percent black, and says, “It was absolutely clear to me the majority of the people in this city wanted to take those monuments down, but they didn’t know how to do it, and they didn’t have the political power. But I did.”
Landrieu lost 37 percent of his white support when he removed the monuments, and polls indicate that nearly nine out of 10 white Lousianans opposed their removal.
Every Tuesday, Landrieu has lunch at a local restaurant with his parents, who are both in their 80s. During a recent meal he approached an older couple he knew to say a quick hello. The wife was wearing a scowl as she leaned in close. “You ruined my life,” she said, twice, then added, “You destroyed my life.” “What did I do?” Landrieu asked, revealing a streak of political confidence that dances along the edge of disrespect. “You took the monuments down,” she said. Landrieu replied, “Are you dying? Did it give you cancer?”
He asserts he did more than just take down the monuments. He also took away something intangible and yet just as weighty as all that bronze and marble: pride. “There is a white Christian ethnic identity that people have tied onto and somehow connected to the Confederacy,” Landrieu says. “They feel like somebody has taken something away from them.”
Jason Dougherty, a 38-year-old white Hazleton resident who works in an Italian diner and stunt fights on the weekends at a converted church called the Sanctuary, thinks that the city has never reckoned with its transformation. “People want to say it is not about race,” he says, “but sometimes it is, and what happened in Hazleton is about difference, and that doesn’t mean it is bad. This place has an energy that just wasn’t there before.”
Hazleton’s population is younger, the hospital is no longer in bankruptcy, and major employers such as Amazon, Cargill, and American Eagle Outfitters have opened distribution centers and plants offering jobs that helped attract the massive Latino migration. Longazel says white residents “miss the opportunity to see that the old-timers and the newcomers came to Hazleton for the same thing: They wanted jobs and a better life for their families. They actually have things in common.”

There are groups working to build cultural bridges. It’s not surprising that many of them, such as the Hazleton Integration Project, focus on young people. Rocco Petrone is the principal of Hazleton Area High School, and he says he knows better than to toss around bromides, such as, “Kids today simply don’t see race.”
A recent survey found that young adults overwhelmingly believe that race relations in the U.S. grew worse last year. Young people have inherited a diverse world. They attend school together, listen to each other’s music, and date across the color line. What will it take to actually shift attitudes as young white people march into adulthood?
Kids have found a way to do something that is more rare among adults. They talk to each other. Yes, they roll their eyes and show annoyance, but they engage and they listen. They cheer for each other on the court and the football field, and they take for granted that a blond homecoming queen named Savannah Butala from the advanced math and science program was crowned alongside a star student named Rafael Santos, who came to Hazleton from the Dominican Republic in 2011.
Few communities have seen the kind of rapid change that Hazleton has. It has produced a lot of discomfort and disorientation, and perhaps a good deal of disgust. Longtime residents are angry about crime, overcrowded schools, and the city budget crisis. They are frustrated that those who are bilingual get paid more or have an easier time moving up the management ladder. Dougherty understands that but says if you look closely, you also see that the changes in Hazleton have produced a lot of discoveries and adjustments. He sees it in his own neighborhood, where people are finally starting to talk to each other, and with co-workers willing to share a beer after work or go to a barbershop together. He sees it at the Sanctuary, where he performs; people there are a bit less tribal, a bit more willing to root for someone who doesn’t share their heritage.
On a weekday morning at the A&L Lounge, Sacco, who is 64, tends bar from a sunken galley that resembles an orchestra pit. The regulars always sit at the bar, close to the televisions and close enough to each other to catch up on town gossip. They drink highballs or beer on tap. They wear work boots and plaid. The tables in the back are where Latino men sit in a circle for a cold one after finishing their overnight shifts in local plants. They have high-maintenance haircuts and fancy tennis shoes. They drink Heineken and Corona, pay in $20 bills, and always leave a tip for Sacco.
They also give him tips on how to speak Spanish. He used to find that irksome, but he has warmed to it. “I should have taken those Spanish classes seriously back in high school, but you know, who knew this was coming?” he said.
Immigrants have been flocking to Hazleton for decades. Putting down roots. Working hard. Raising families. Striving. Climbing. Spending money in local businesses. But the word “immigrant” takes on a different tone now. Older Hazleton residents who are themselves the children of immigrants often say the word with a sneer.
Sacco loved growing up in Hazleton and keeps a collection of memorabilia that shows the town as it was in the era he considers its heyday, when Broad Street had supper clubs and theaters with neon lights. He’s angry about the changes in his hometown. Really angry.
And yet, does he resent the men who come to his bar and spend money? After all, they represent the change that chafes so much. “Hard to be angry at them,” he said. “They are just working hard, and I respect that. I guess you have to respect that.”
Resources
nationalgeographic.com, “The Know-Nothings: the United States’ first anti-immigration party: Conceived in fear and prejudice in the 1800s, the short-lived Know-Nothing Party’s intolerance toward German and Irish immigrants led to violence across the young nation.” By Amy Briggs; nationalgeographic.com, “200 Years of U.S. Immigration Looks Like the Rings of a Tree: These data visualizers imagined each era of U.S. immigration as a ring in a growing tree trunk.” by Pedro M. Cruz and John Wihbey; nationalgeographic.com, “As America Changes, Some Anxious Whites Feel Left Behind: Demographic shifts rippling across the nation are fueling fears that their culture and standing are under threat.” BY MICHELE L. NORRIS; en.wikipedia.org, “History of immigration to the United States.” By Wikipedia Editors; history.com, “U.S. Immigration Timeline: Attitudes and laws around U.S. immigration have vacillated between welcoming and restrictive since the country’s beginning.” By HISTORY.COM EDITORS; migrationpolicy.org, “Immigration Has Been a Defining, Often Contentious, Element Throughout U.S. History.” By Jessica Bolter; carnegie.org, “15 Myths About Immigration Debunked: Alex Nowrasteh of the Cato Institute offers nonpartisan facts in response to common myths about immigration.” By Carnegie Corporation of New York; washingtonpost.com, “What’s going on at the border and why is it becoming a midterm issue?” By Amber Phillips;
What’s going on at the border and why is it becoming a midterm issue?
Crossings and attempted crossings of the U.S.-Mexico border are at record levels, and climbing.
It’s becoming a campaign issue, as Republicans accuse President Biden of being too lenient at the border, and liberal Democrats accuse Biden of being too tough. Many observers also worry that crowded border conditions are fast becoming a humanitarian problem.
Here’s what’s happening at the border and how it could affect Democrats’ chances to stay in power in November’s midterm elections.
Border crossings are up. Why?
A variety of reasons. There’s a huge labor demand in the United States right now, and the Mexican economy in particular is lagging. (Most of the people trying to cross are Mexicans, but there is a significant flow of people from other countries across the region, like Cubans and Colombians.) The pandemic has exacerbated the struggles of local economies and uprooted many people from their communities.
And there’s a general sense, fairly or not, that it’s easier to cross now than ever because Biden is president, compared with Donald Trump, who was known globally for his anti-immigration rhetoric and policies.
About 15,000 Ukrainians escaping war have come to Mexico to be allowed across the border. They were largely welcomed and given one-year humanitarian parole in the United States, reports The Washington Post’s Kevin Sieff. (The administration has started denying them access at the southern border as they roll out a program to allow Ukrainians into the country by other means.) But Ukrainians are still only a small fraction of the people trying to cross the border.
How many people are crossing the border?
To understand the politics of the border requires understanding the numbers coming from it. There are many ways to break down the data. Here are three big ones.
1. People who cross illegally and are never caught: The nature of this stat is that it’s difficult to track. But there are cameras stationed on remote outposts along the border, and Post immigration reporter Nick Miroff says that border officials have acknowledged that anywhere from 1,000 to 2,000 of these border crossings a day are detected but not intercepted.
2. People who are apprehended: This is the number you’ll hear about the most, because it’s what the government measures most consistently. “Apprehensions” measures how many times the government encounters someone at the border who doesn’t have legal authorization to enter the country. This is a gauge of how busy U.S. Customs Border Protection is, rather than a full counting of people trying to cross. Most people apprehended at the border have been turned away, under the Title 42 public health code that Biden plans to end soon: In the past six months, the government has apprehended, and then removed, people at the border some 549,000 times.
3. People who are apprehended and then processed by immigration authorities: These are people who cross the border, get processed by immigration officials and who are let go to various ends, like applying for asylum. Over the past six months, about 500,000 people were taken into custody but not immediately expelled. Some were deported, but most remain in the United States pending a court hearing. It can take years for their asylum cases to resolve, and many people just end up staying in the country, under the radar.
So, of the roughly 1 million or more apprehensions at the border in the past six months, about half have resulted in people being immediately kicked back out, and less than half have resulted in people being processed by immigration authorities. The second group includes people allowed to stay in the country and apply for asylum and other humanitarian statuses.
All three numbers have reached historic highs, said Jessica Bolter with the nonpartisan Migration Policy Institute, “but it’s not the case that everyone who comes to the border gets in.”
How high are border crossings historically?
Here’s a visual comparison of apprehensions at the border, going back to the Obama administration.
About half of those apprehended in the past six months were sent back to their home country. Slightly less than half were let in to apply for asylum or other humanitarian statuses.
How Title 42 factors into all of this
Title 42 is a public health order put in place by the Trump administration that allows the government to send migrants back to their home countries, rather than hold them in detention at the border and process them. Though it’s controversial, the Biden administration kept the policy for more than a year, to prevent the border from becoming unmanageable. It plans to phase it out in May.
But that move is now tangled up in legal wrangling: A group of Republican attorneys general sued to keep the policy in place, and a federal judge in Louisiana agreed to temporarily block the Biden administration from lifting it.
Lifting this policy will likely mean that migrants will think it’s easier to come to the border and apply for asylum. And border crossings will likely spike.
“We expect migration levels to increase as smugglers seek to take advantage of and profit from vulnerable migrants,” Homeland Security Secretary Alejandro Mayorkas told Congress recently.
“Once someone makes it across the border, if they’re not expelled under Title 42, there is a pretty good chance they will be able to stay in the United States at least for several years,” said Bolter from the Migration Policy Institute, adding that this is truer for families traveling together.
The administration worries that this dynamic could send an influx of migrants to communities along the U.S.-Mexico border that aren’t prepared to handle them. That could create humanitarian crises on the border — and major political problems for Biden.
This is putting pressure on Biden on all sides
Biden has struggled politically with the border since he took office. Attempted crossings rose when he became president, under the belief that he would be more lenient to migrants than Trump was.
We’ve seen some troubling images arise from crowded border situations, like that of a White Border Patrol agent on horseback trying to catch Haitian men.
Biden is facing political pressure from all sides on immigration policy. Republicans and some moderate, vulnerable Democrats on the ballot in November say Biden shouldn’t lift Title 42 because it will create chaos at the border.
Republicans point to the high number of apprehensions as evidence that the Biden administration being in over its head. “The border crisis is raging unchecked,” the Republican National Committee recently said. The GOP is also trying to connect these numbers to the fentanyl drug crisis in America, since the illegal, synthetic version of the drug can be smuggled from Mexico.
Biden’s defenders counter that the high number of apprehensions show that border security is strong — and that Republicans can’t claim Biden has an open-border policy while also urging Biden to continue keeping a Trump-era restriction.
Liberal activists, meanwhile, are criticizing the Biden administration as being no better than Trump’s: “It’s an abomination that the Biden administration did not lift Title 42 a long time ago,” former Housing and Urban Development secretary Julián Castro told The Post’s Annie Linskey and Miroff in March.
This is all resonating beyond border states. As Linskey and Miroff report, more than a third of voters in Wisconsin, which has some very competitive congressional races this November, said in a recent poll they were “very concerned” over illegal immigration.
As Republicans try to recapture the House of Representatives in November’s midterm elections, House Minority Leader Kevin McCarthy (R-Calif.) traveled to the border in April and claimed that Biden isn’t doing enough to stop the flow of migrants into the country. “This crisis is created by the presidential policies of this new administration,” he said.
How Biden has changed Trump’s immigration policies
Other than keeping Title 42 in place, Biden has softened Trump’s immigration policies quite a bit.
His administration has cut way back on deporting people who are already in the country illegally. Arrests last year fell to their lowest levels since at least 2015.
He ditched Trump’s “Remain in Mexico” policy, which required many migrants to stay in Mexico while they wait for decisions on their asylum claims. A federal judge later forced the administration to reinstate it. In April the Supreme Court heard oral arguments in a case, Biden v. Texas, about whether the president can end the program.
And this spring, the Biden administration will make a big change in how it processes asylum cases. It will allow asylum officers at the border to grant asylum there, rather than pass the case onto judges in a bogged-down court system. It also would send people who don’t get asylum at the border to immigration courts, which usually take months to wrap up a case. (Right now, it takes years.) Immigration analysts say this could help tamp down on the notion that coming to the border and asking for asylum is an easy way to get into the country.
But soon Biden will be without his main tool to suppress border crossings, just months before an election where his party could lose control of one or both chambers of Congress, and where Republicans are making immigration a bigger and bigger issue.
“Both the Trump and Biden administration became really addicted to Title 42,” said immigration analyst Cris Ramón, “because all of a sudden you had this rapid instrument to remove migrants from the border.”
Addendum
15 Myths About Immigration Debunked
Alex Nowrasteh of the Cato Institute offers nonpartisan facts in response to common myths about immigration
What are the common arguments against immigration, and why are they wrong? The Cato Institute’s Alex Nowrasteh, drawing on years of research and debate, counters 15 common myths against immigration with nonpartisan facts in the report The Most Common Arguments Against Immigration and Why They’re Wrong. The Corporation supports the Cato Institute’s immigration program where Nowrasteh is director of immigration studies and the Herbert A. Stiefel Center for Trade Policy Studies.
MYTH #1: “Immigrants will take American jobs, lower wages, and especially hurt the poor.”
FACT: Immigrants don’t take American jobs, lower wages, or push the poor out of the labor market.
MYTH #2: “It is easy to immigrate here legally. Why don’t illegal immigrants just get in line?”
FACT: It’s very difficult to immigrate legally to the United States. Immigration law is second only to the income tax code in legal complexity.
MYTH #3: “Immigrants abuse the welfare state.”
FACT: Immigrants use significantly less welfare than native-born Americans.
MYTH #4: “Immigrants increase the budget deficit and government debt.”
FACT: Immigrants in the United States have about a net zero effect on government budgets — they pay about as much in taxes as they consume in benefits.
MYTH #5: “Immigrants increase economic inequality.”
FACT: Maybe. The evidence on how immigration affects economic inequality in the United States is mixed — some research finds relatively small effects, and some finds substantial ones. The standard of living is much more important than is the income distribution.
MYTH #6: “Today’s immigrants don’t assimilate as immigrants from previous eras did.”
FACT: Immigrants to the United States — including Mexicans — are assimilating as well as or better than immigrant groups from Europe over a hundred years ago.
MYTH #7: “Immigrants are a major source of crime.”
FACT: Immigrants, including illegal immigrants, are less likely to be incarcerated in prisons, convicted of crimes, or arrested than native-born Americans.
MYTH #8: “Immigrants pose a unique risk today because of terrorism.”
FACT: The annual chance of being murdered in a terrorist attack committed by a foreign-born person on U.S. soil from 1975 through the end of 2017 was about 1 in 3.8 million per year.
MYTH #9: “The United States has the most open immigration policy in the world.”
FACT: The annual inflow of immigrants to the United States, as a percentage of our population, is below that of most other rich countries in the Organization for Economic Cooperation and Development.
MYTH #10: “Amnesty or a failure to enforce our immigration laws will destroy the Rule of Law in the United States.”
FACT: America’s current immigration laws violate every principal component of the Rule of Law. Enforcing laws that are inherently capricious and that are contrary to our traditions is inconsistent with a stable Rule of Law.
MYTH #11: “Illegal immigration or expanding legal immigration will destroy American national sovereignty.”
FACT: Different immigration policies do not reduce the U.S. government’s ability to defend American sovereignty.
MYTH #12: “Immigrants won’t vote for the Republican Party — look at what happened to California.”
FACT: Republican immigration policies pushed immigrants away, not the other way around.
MYTH #13: “Immigrants bring with them bad cultures, ideas, or other factors that will undermine and destroy our economic and political institutions. The resultant weakening in economic growth means that immigrants will destroy more wealth than they will create over the long run.”
FACT: There is no evidence that immigrants weaken or undermine American economic, political, or cultural institutions.
MYTH #14: “The brain drain of smart immigrants to the United States impoverishes other countries.”
FACT: The flow of skilled workers to rich nations increases the incomes of people in the destination country, enriches the immigrants, and helps (or at least does not hurt) those left behind.
MYTH #15: “Immigrants will increase crowding, harm the environment, and [insert misanthropic statement here].”
FACT: People, including immigrants, are an economic and environmental blessing and not a curse.
Race Relations and Slavery Postings
https://common-sense-in-america.com/2020/10/20/reparations-can-go-both-ways/
https://common-sense-in-america.com/2020/10/16/who-are-the-proud-boys/
https://common-sense-in-america.com/2020/09/10/fatal-shootings-by-the-police-the-true-story/
https://common-sense-in-america.com/2020/08/22/racism-how-prevelant-is-it/
https://common-sense-in-america.com/2020/08/15/slavery-our-place-in-its-history/
https://common-sense-in-america.com/2020/08/13/illegal-immigrants-in-america-what-will-be-their-fate/
https://common-sense-in-america.com/2020/07/27/walls-tunnels-and-ladders-oh-my/
https://common-sense-in-america.com/2020/07/23/how-can-protesters-justify-vandalism/
https://common-sense-in-america.com/2020/07/17/antifa-whats-it-all-about/
https://common-sense-in-america.com/2020/07/13/is-trump-racist/
https://common-sense-in-america.com/2020/07/09/is-privilege-based-on-skin-color-and-culture/
https://common-sense-in-america.com/2020/07/07/black-lives-matter/
https://common-sense-in-america.com/2020/06/23/violence-and-fear-as-a-tool-of-the-left/
https://common-sense-in-america.com/2020/06/22/open-borders-unlimited-immigration-who-does-it-benefit/
https://common-sense-in-america.com/2020/06/22/juneteenth/
https://common-sense-in-america.com/2020/06/21/did-christopher-columbus-deserve-a-statue/
https://common-sense-in-america.com/2020/06/17/corporate-donations-to-the-blm-and-attempt-to-placate-the-left/
https://common-sense-in-america.com/2020/06/08/unemployment-in-the-black-population/
https://common-sense-in-america.com/2020/06/08/insurrection-act/
https://common-sense-in-america.com/2020/06/07/protesting-versus-rioting/
https://common-sense-in-america.com/2020/06/06/immigration/
https://common-sense-in-america.com/2020/06/12/standing-up-for-yourself-yes-doesnt-mean-no/
https://common-sense-in-america.com/2020/06/18/antisemitism-then-and-now/
https://common-sense-in-america.com/2020/07/29/hate-and-extremists-groups-in-america/
https://common-sense-in-america.com/2021/04/06/illegal-immigration-or-legal-immigration-what-is-the-diff/
https://common-sense-in-america.com/2021/05/16/race-relations-in-the-last-100-plus-years/
https://common-sense-in-america.com/2021/05/28/native-american-indians-in-race-relations-in-the-last-100-plus-years/
https://common-sense-in-america.com/2021/05/30/__trashed-2/
https://common-sense-in-america.com/2021/06/01/asian-americans-in-race-relations-in-the-last-100-plus-years/
https://common-sense-in-america.com/2021/09/24/not-blonde-and-blue-eyed/
https://common-sense-in-america.com/2021/10/26/who-is-herbert-marcuse-and-why-did-he-hate-america/
https://common-sense-in-america.com/2022/02/04/race-vs-ethnicity/
https://common-sense-in-america.com/2023/01/24/history-of-immigration-in-our-country/